
StockResearch Intelligence Weekly #15

1. Beneath the Calm: A Generational Rotation
The S&P 500 closed +0.55% at 7,165.08 — a fresh all-time high but the slowest weekly print in five. Nasdaq +1.50% to 24,836.60, also a record (QQQ +2.32%). Dow −0.44%. Russell 2000 +0.43% (IWM +0.67%). VIX 18.71 (+7%). On the surface, a quiet week. Underneath, the most violent sector rotation since November.
Three forces drove the tape, and they did not align. Semiconductors went vertical — Intel +24% Friday (best day since 1987), Nvidia retook $5T market cap, AMD +14%, SOXX +40.4% MTD. Software whipsawed — ServiceNow’s record −18% Thursday dragged CRM/WDAY/HUBS/IBM into 6–9% sympathy declines, but a Friday rebound left IGV roughly flat W/W. The geopolitical script flipped — Polymarket peace-deal odds collapsed from ~60% to ~10%, USO +13.2% W/W, Brent around $105, Hormuz still closed.
Mega-cap chips carried the indices alone. Five of eleven sectors finished lower; UMich consumer sentiment printed 49.8 — a record low. The forward calendar concentrates everything into a 72-hour window: MSFT, GOOGL, META print Wednesday April 29 AMC; FOMC same afternoon; AMZN/AAPL Thursday; Core PCE Thursday; April NFP Friday. Five days will decide whether the bull thesis survives the bifurcation.

2. Strengths: Earnings Tone, Chip Rotation, and Macro Resilience
-
The earnings beat rate is intact and accelerating. With ~28% of the S&P 500 reported, ~80% are beating and the blended Q1 growth rate has risen W/W (per FactSet). If Q1 revenue growth holds at 10.3%, it would be the highest print since Q3 2022. Forward Q2 estimates of +20.6% imply continued tailwind.
-
The semiconductor leg got structural validation. Intel’s Q1 didn’t just beat — it reframed the CPU’s role. Data Center +22% YoY to $5.1B; Q2 guide $14.3B mid vs. $13.07B Street; AI revenue 60% of mix, +40% YoY. CEO Lip-Bu Tan’s framing — “the CPU is reinserting itself as the indispensable foundation of the AI era” — was the line the desk took home. Combined with TXN’s +10% on guidance and Nvidia’s $5T reclaim, this is rotation built on real numbers.
-
Macro held in despite the war. April Flash Manufacturing PMI hit 54.0 — a 47-month high; March Retail Sales +0.6% ex-gas; Composite rebounded to 52.0. Honest caveat: Williamson flagged the manufacturing strength as “stock building” ahead of price hikes, not organic demand. But US Composite at 52.0 stands in stark contrast to Eurozone Composite at 48.6 (17-month low).
3. Weaknesses: Iran Re-Prices, Software Cracks, and Sentiment Hits a Record Low
-
The geopolitical scenario flipped in five trading days. Polymarket peace-deal odds for end-April fell from ~60% to ~10%. USO closed +13.2% W/W, fully reversing the prior week’s post-ceasefire bottom. Brent held around $105. Hormuz remains closed. The US–Iran ceasefire was extended indefinitely awaiting a new proposal from Tehran — a holding pattern, not a resolution. Equities held in. Oil did not.
-
Software entered an AI-disruption regime — even if the ETF didn’t break. ServiceNow’s −18% Thursday was the worst day in its listed history. Subscription growth came in-line at +22%, but management cited Iran-driven deal delays and CRM/WDAY/HUBS/IBM all sold off 6–9% in sympathy on the same session. IGV closed flat W/W only because the cohort had already had its best multi-week run since October 2001 going into Wednesday. AI tools are now compressing the SaaS subscription model, and every software earnings print will be priced against that fear.
-
Consumer sentiment printed the lowest reading on record. UMich final April came in at 49.8 — comparable to the June 2022 trough. Year-ahead inflation expectations spiked from 3.8% to 4.7% (largest one-month jump since April 2025). Director Hsu was explicit: the Iran conflict’s transmission is gasoline. Sentiment doesn’t improve until oil resolves — and oil doesn’t resolve until Hormuz reopens.
4. Weekly Market Recap — Week Ending April 24, 2026
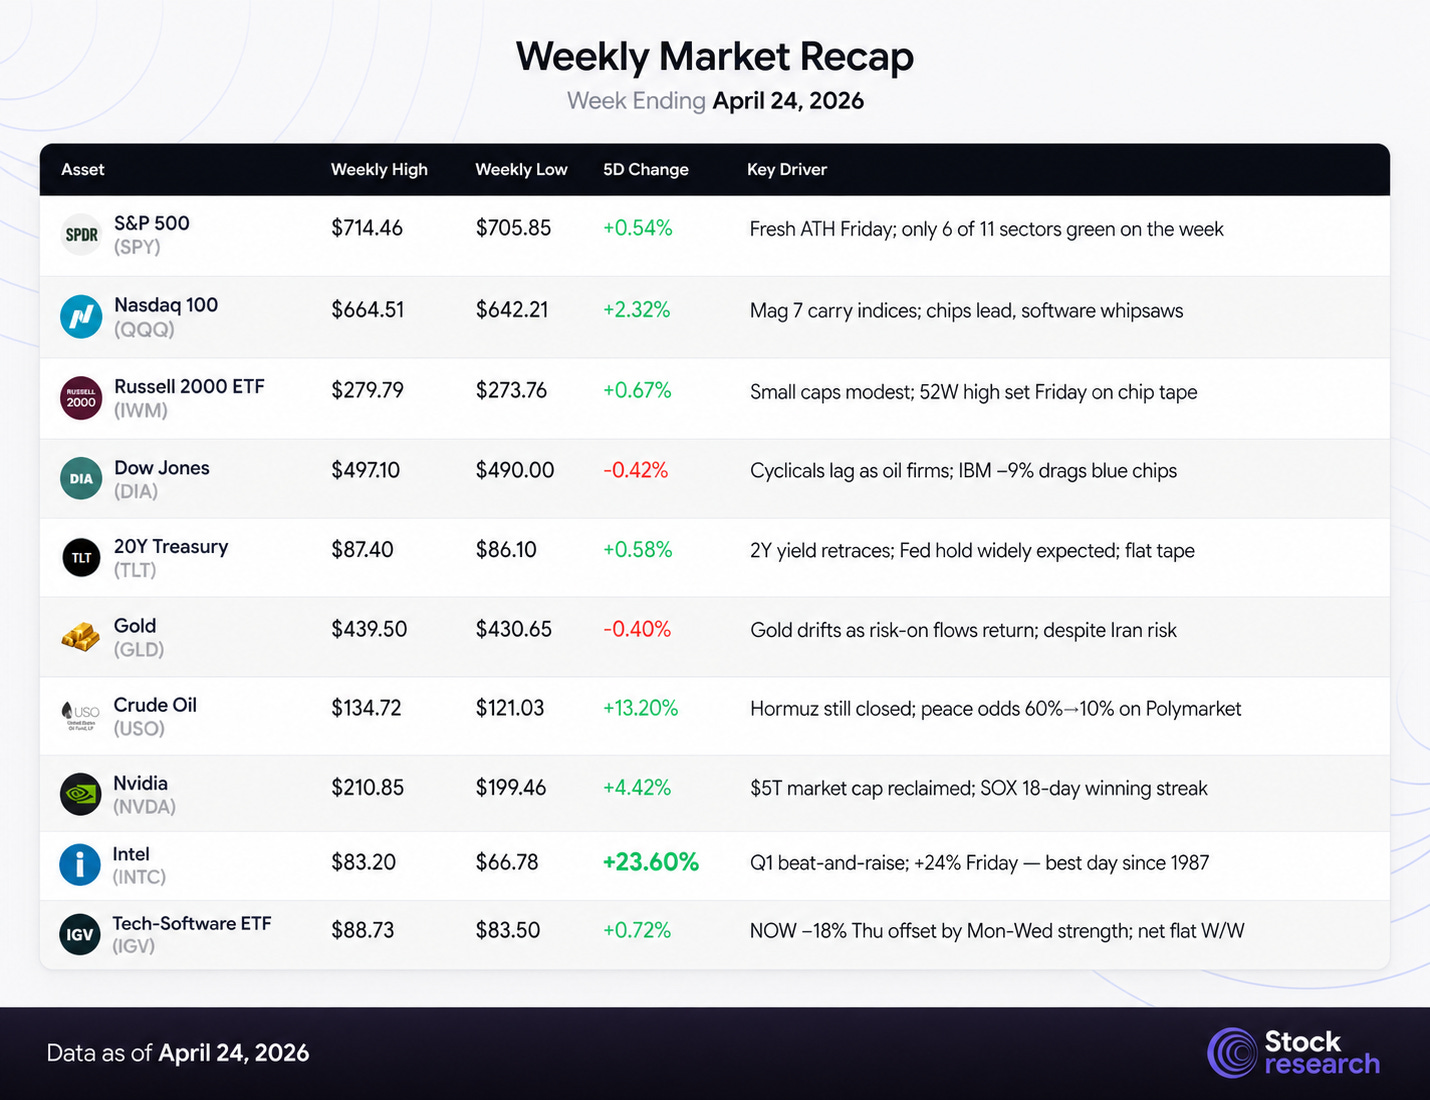
The week’s signature: new highs on narrowing leadership, with software whipsawing in the middle. The S&P 500 and Nasdaq both closed at fresh records, but breadth was uneven — five of eleven sectors finished lower, and the move was carried almost entirely by semiconductors. Intel’s +24% Friday session — its best since 1987 — and Nvidia retaking $5T market cap pushed the SOX to an 18-day winning streak. ServiceNow’s worst day on record dragged IBM, Salesforce, Workday, and HubSpot into −9% sympathy declines on the same Thursday session — yet the software cohort closed the week roughly flat as the Mon-Wed advance offset the Thu-Fri damage. Cross-asset, oil firmed sharply (USO +13% W/W) as Iran tensions reignited, gold drifted as risk-on flows returned, and Treasuries ended modestly higher with rates roughly flat.
5. Top 3 Stock Picks for Long-Term Investment
AI Price Forecast Dashboard — Updated Week Ending April 24, 2026
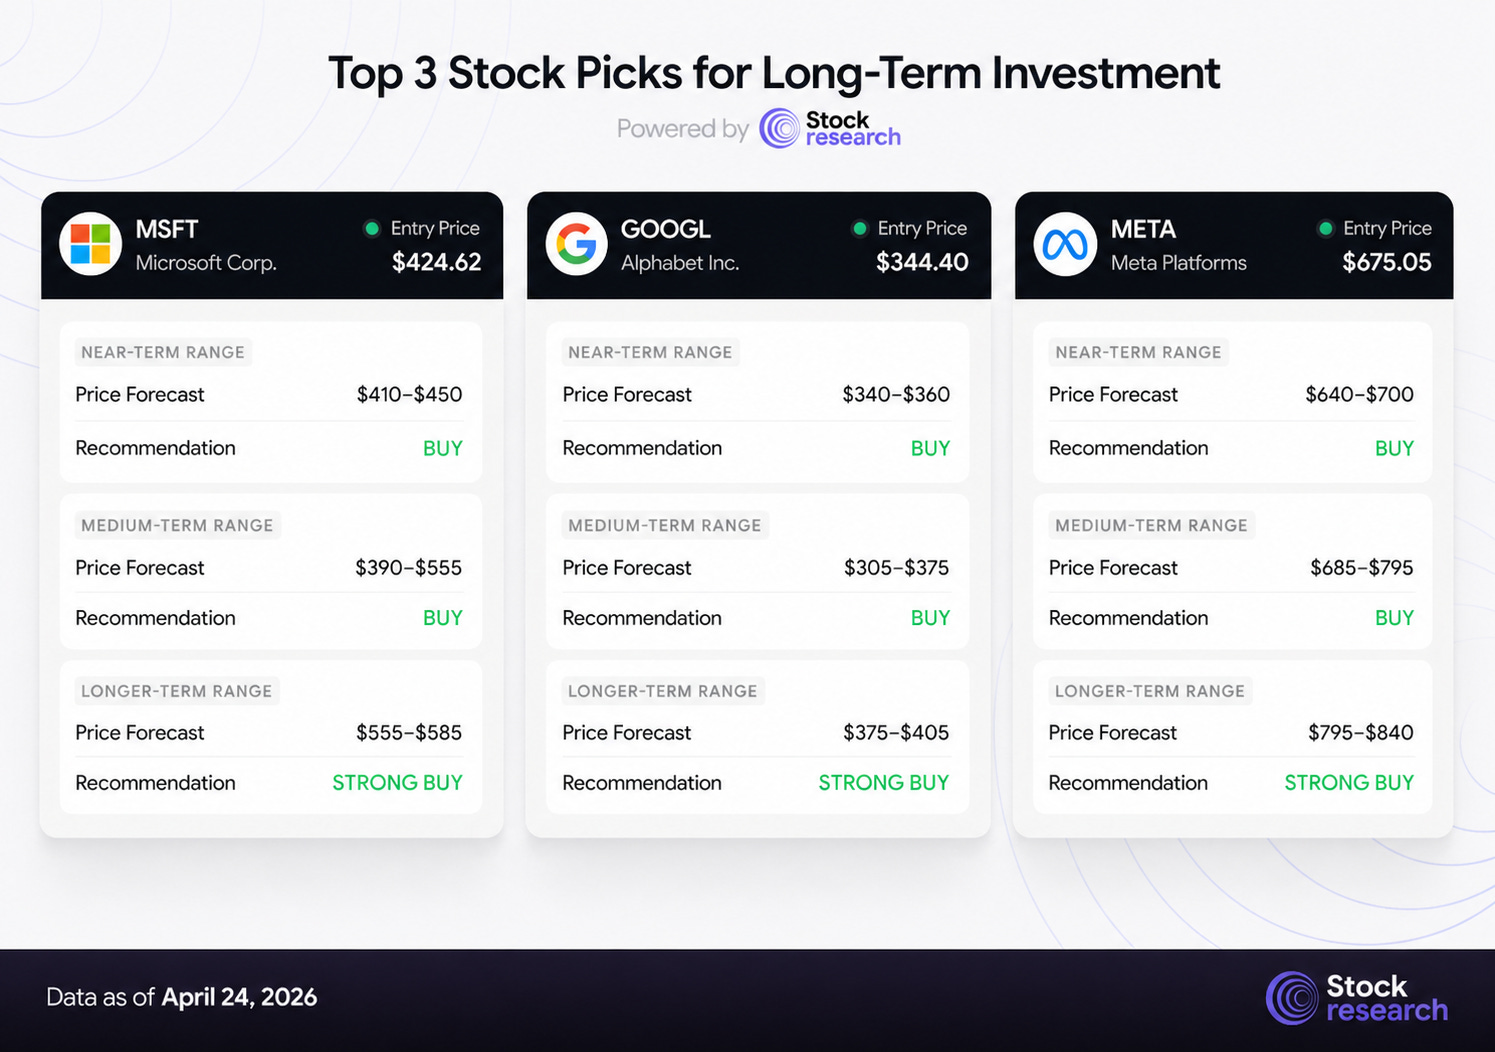
Price: $424.62 | Market Cap: $3.16T | Forward P/E: ~24x | 52W High: $552.24 | Earnings: April 29 AMC
Thesis: Microsoft is the cleanest expression of enterprise AI monetization at scale. Azure is not decelerating — management’s most recent commentary guided Q3 FY2026 Azure growth to +37–38% constant-currency, following +39% in Q2 FY26. Capex has tracked toward $80B+ annualized, but every dollar is absorbed by contracted hyperscaler and enterprise demand. Copilot paid seats reached approximately 15 million as of December 31, with +160% YoY growth — early but compounding. The total commercial backlog is roughly $625B; Azure alone carries an estimated $80B backlog, which means supply, not demand, has been the binding constraint.
Why now: MSFT closed at $424.62 — sitting just above the 50-day moving average ($422) and roughly 23% below the 52-week high of $552. The stock has de-rated from 30x+ forward earnings last year to ~24x today. Expectations are calibrated; Azure’s bar is beatable given management’s own Q3 guide. The print Wednesday April 29 after the close is the single most-watched tech event of 2026 because Microsoft sits in all three AI phases — infrastructure (the Nvidia spend), cloud (Azure), and applications (Copilot, Dynamics, Fabric). A clean print would ratify the chip rally; a wobble would reset the entire AI capex narrative.
Key Levels: Support at $422 (50-day MA) and $389 (200-day MA). Resistance at $450 (clean breakout trigger) and $552 (52-week high, structural target). A beat-and-raise through $450 opens the next leg.
Risk Factors: Hyperscaler capex digestion commentary if any peer pre-announces a 2026 capex cut; Azure backlog deceleration; OpenAI dependency (double-edged); regulatory scrutiny on AI/data competition. The bar on Azure is high enough that even a +37% in-line print could be sold short-term.
Verdict: STRONG BUY on any pullback to $410–420 pre-print; HOLD into the April 29 release. Consensus mean PT $584 (34 analysts, Strong Buy, +37% implied upside). Structural 6–12 month target range: $552 → $585.
#2: Alphabet Inc. (GOOGL)
Price: $344.40 | Market Cap: ~$4.16T | Forward P/E: ~28x | 52W High: $349.00 | Earnings: April 29 AMC
Thesis: Alphabet spent most of 2025 priced as if Search were structurally impaired by generative AI. That thesis has broken. Gemini in Search (”AI Overview”) has not collapsed query volume or revenue per query — both stabilized in Q4 2025 and turned positive in Q1. Cloud has re-accelerated to the high-20s in growth; YouTube prints double-digit ad growth; Waymo’s commercial ride volume continues to compound. Critically, this week Google announced two new TPU AI chips designed to compete directly with Nvidia and committed up to $40 billion in additional investment in Anthropic ($10B initial). The framing — “Google doesn’t pay the Nvidia tax” — is now a real strategic differentiator, not a slide-deck claim.
Why now: GOOGL closed at $344.40 — a fresh all-time closing high Friday, with the 52-week intraday high at $349.00 effectively being tested. The DOJ remedies phase is approaching resolution with the Street base case shy of a forced Chrome/Android divestiture; that alone is worth 5–8% of multiple expansion. Q1 2026 earnings land Wednesday, April 29 after the close. A weekly close above $349 opens the path to the upper analyst targets quickly.
Key Levels: Support at $325 (recent base), $306 (50-day MA), $300 (200-day MA). Resistance at $349 (52-week high, currently being tested), $375 (high-end analyst targets). A clean breakout above $350 on the print would be technically clean.
Risk Factors: DOJ remedies could surprise hawkish; AI-native search competitors (Perplexity, OpenAI) chipping query share more aggressively; Waymo unit economics remain unproven at scale; EU regulatory tail risk persists. Custom TPU chips also compete with one of GOOGL’s largest cloud customers’ suppliers — a delicate balance.
Verdict: BUY. Breaking 52W high on volume into the April 29 print, with a credible chip-vertical-integration story now layered on top of Search durability. Consensus mean PT $358 (44 analysts, Strong Buy, +4% implied); upper analyst target $405 if antitrust overhang lifts and Cloud margin expands into H2.
#3: Meta Platforms Inc. (META)
Price: $675.05 | Market Cap: $1.71T | Forward P/E: ~19x | 52W High: $794.38 | Earnings: April 29 AMC
Thesis: Meta is the AI capex test bellwether. The company is projected to spend up to $135B in capex in 2026 — a level that prompted Erste Group to downgrade to Hold this week — and management has signaled an additional 10% workforce reduction to fund the AI buildout. Meanwhile, advertising revenue continues to grow at +24% with operating discipline holding gross margin near 82% and net margin above 37%. The recently announced multi-year AWS Graviton5 deal further suggests Meta is diversifying away from Nvidia dependence — the same playbook GOOGL is running. Forward P/E at ~19x is well below the structural growth rate.
Why now: META at $675.05 sits roughly 15% below its 52-week high of $794.38 — the stock has corrected meaningfully, partly on capex anxiety and partly on the broader Mag 7 wobble in March/early April. The April 29 print will be the cleanest read on whether mega-cap AI capex is being absorbed by ad revenue growth and operating leverage, or whether the gap opens up. With Microsoft and Alphabet printing the same evening, a coordinated three-way ratification (or three-way disappointment) is the actual signal — not any one print in isolation.
Key Levels: Support at $640 (50-day MA, now acting as floor), $683 (200-day MA — currently overhead). Resistance at $700 (round-number psychological), $794 (52-week high). A weekly close above $700 on the print opens the path back to the 200-day quickly.
Risk Factors: Capex-to-revenue ratio breach (the “Year of Efficiency” hangover); Reality Labs continues to bleed; potential 2026 ad-spend deceleration if oil-linked inflation dents consumer discretionary spending; regulatory action on Instagram/teen safety; Erste Group’s downgrade tells you the bear case is now mainstream.
Verdict: BUY with discipline — own size into the print, but defined risk via $640 stop (50-day MA). Consensus mean PT $840 (40 analysts, Buy/Strong Buy, +24% implied). The asymmetry is favorable at 19x forward for a 24% revenue grower with 37% net margins, but only if the capex pays off on a visible monetization line.
6. Low-Cap Opportunities
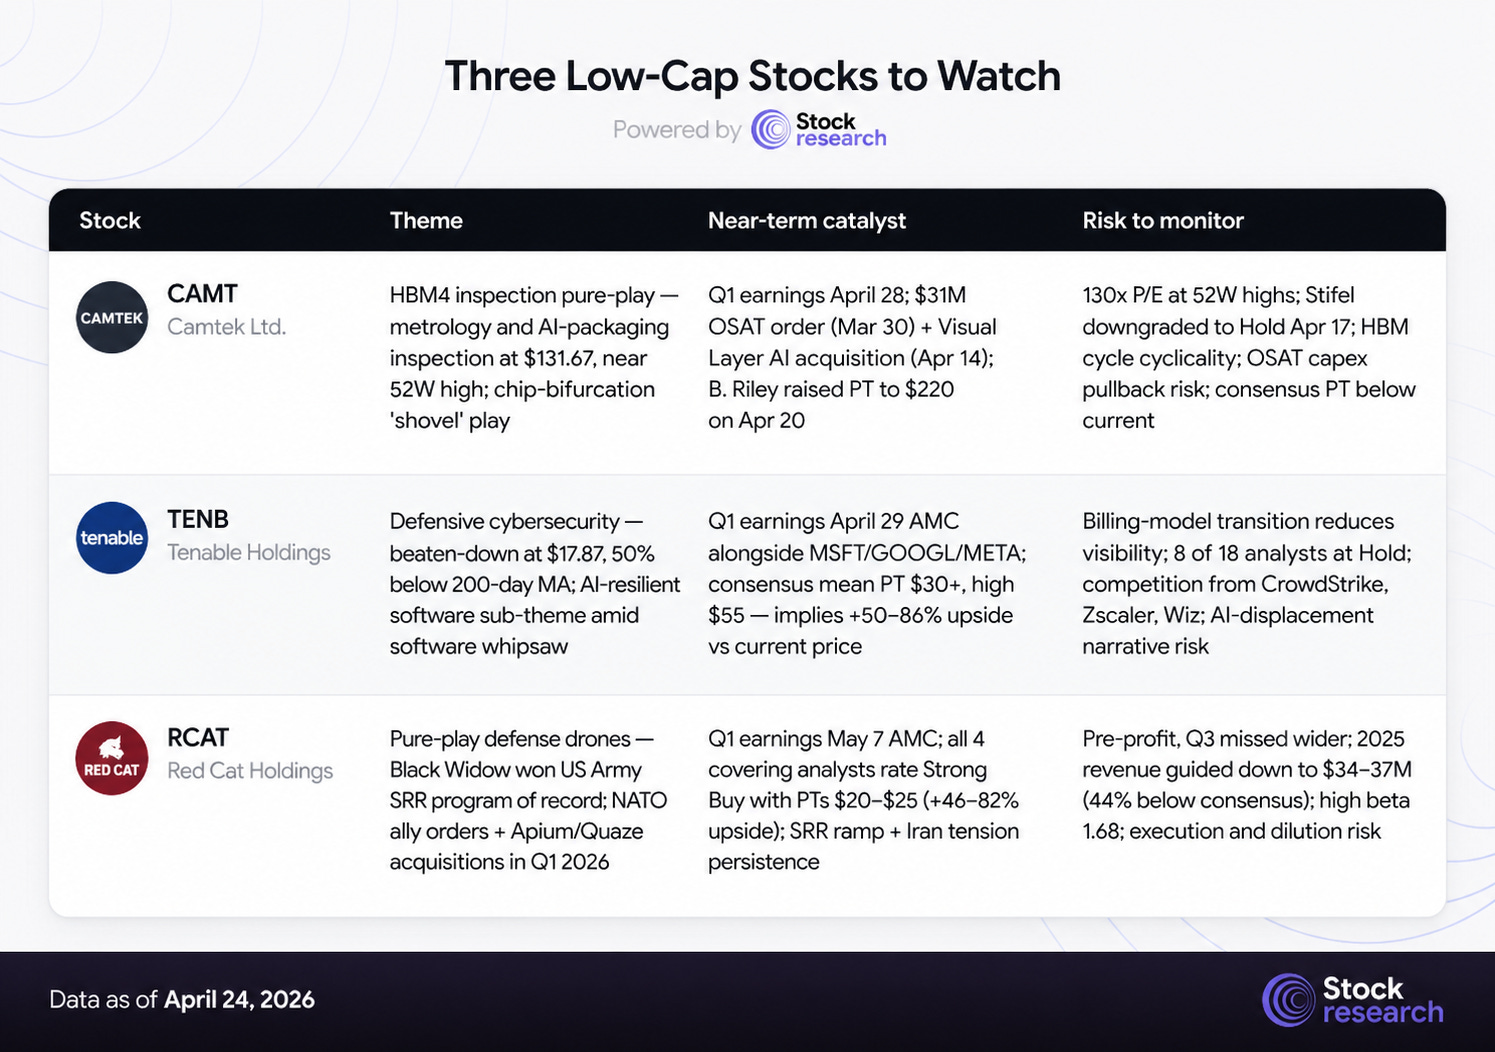
Camtek Ltd. (CAMT) — HBM4 Inspection at 52-Week Highs
Price: $131.67 | Market Cap: $6.0B | 52W Range: $47.41 – $129.41 | Earnings: April 28
Camtek is the cleanest equipment-side expression of the chip-bifurcation thesis — it makes the Hawk and Eagle metrology and inspection platforms that AI packaging (CoWoS-like) and high-bandwidth memory (HBM4) require. The setup is loud: Q1 2026 OSAT bookings exceeded $90M, the company landed a $31M multi-system order March 30, B. Riley raised PT to $220 on April 20 citing HBM4 positioning, and Camtek closed an acquisition of AI inspection specialist Visual Layer on April 14.
Why HOLD, not BUY: The stock has run from $47 to $131 — +180% off the lows and now sitting near its 52W high of $129. Forward P/E is ~130x. Median consensus PT is $129 — below current price. Stifel cut to Hold on April 17. Buying into a binary print at-or-near 52W highs with consensus already met is poor risk/reward. The bull case is intact, but the entry is wrong.
Verdict: HOLD into the print. Re-engage on either (a) post-print pullback to $110–115 (upper analyst PT band, 50-day MA support), or (b) breakout above $135 with conviction confirmed by HBM4 commentary. Stop on existing positions: $115. No new BUY at current levels.
Tenable Holdings (TENB) — Cybersecurity, Beaten Down, Catalyst-Rich
Price: $17.87 | Market Cap: $2.2B | 52W Range: $17.27 – $37.14 | Earnings: April 29 AMC
Tenable is the cleanest setup of the three. The stock has been smashed — down nearly 50% from its 52W high of $37 — and trades near the absolute low end of the consensus PT distribution ($19 low / $30 mean / $55 high implies +50–86% upside). Cybersecurity is the AI-resilient corner of software: enterprises do not cut security spend in a tightening macro, and TENB’s Nessus + Tenable One platform retains durable enterprise attach.
Why now: Earnings April 29 AMC — the same evening as MSFT, GOOGL, META, and Visa. The reaction window is amplified across the entire software cohort. If hyperscaler Azure/Cloud commentary stabilizes the AI-disruption narrative for software broadly, oversold names like TENB are positioned to bounce hard. The stock trades 49.9% below its 200-day MA of $26.26 — a level that defines technical mean-reversion targets if even a modest beat lands.
Honest framing: This is not consensus-loved. Eight of 18 analysts hold; the bear case (CCB billing transition reducing visibility, declining gross margins from cloud reinvestment, AI-displacement competition from CrowdStrike and the Wiz/Google deal) is real. But the price has already absorbed those concerns. The risk/reward at $18 is far better than the risk/reward at $25.
Verdict: SPECULATIVE BUY at $17–18 with a $16 stop and earnings-defined sizing. Target band $26 (200-day MA mean reversion) → $30 (consensus mean PT). Half-position pre-print, optional add post-print on confirmation.
Red Cat Holdings (RCAT) — Drone Pure-Play With Program of Record
Price: $13.71 | Market Cap: $1.6B | 52W Range: $4.58 – $18.78 | Earnings: May 7 AMC
Red Cat is the only name in the section that is unambiguously aligned with the geopolitical persistence thesis. The Black Widow drone won the U.S. Army Short Range Reconnaissance program of record in November 2024 with a stated acquisition objective of 5,880 systems over five years. The company secured new Black Widow orders from a NATO ally on April 2, closed acquisitions of Apium Swarm Robotics and Quaze Technologies in late March, and has expanded production capacity 520% YoY across air, maritime, and counter-UAS divisions.
Why now: Q1 earnings May 7 AMC. All four covering analysts rate Strong Buy with PTs $20–$25 — implying +46% to +82% upside. Northland raised PT to $22 (Mar) and Ladenburg raised to $20 (Mar). The macro backdrop is structurally favorable: with the U.S. producing under 1M drones annually versus China’s 4M, and with Hormuz still closed, drone-production scaling is no longer optional — it’s a defense-industrial-base priority. RCAT’s Innovation Day (Feb 27) demonstrated multi-domain integration of Black Widow drones with USVs, validating the platform thesis.
Honest framing: This is high-beta (1.68), pre-profit, and execution-dependent. 2025 revenue was guided down to $34.5M–37.5M (about 44% below Street consensus) due to product-release timing and government shutdown impact. Q3 2025 missed wider than expected. Sept 2025 saw a $150M public stock offering (dilution risk has been priced in but is a recurring feature). Black Widow’s SRR ramp velocity is the single biggest variable — if Q1 unit deliveries beat, the stock can re-rate sharply; if delivery commentary is conservative, $11 support gets tested.
Verdict: SPECULATIVE BUY at $13–14 with an $11 stop. Target $20 (mean analyst PT, +46% upside) → $25 (high analyst PT, structural). Smaller-than-normal position size given pre-profit status and 2025 guidance miss; this is high-conviction asymmetric exposure, not a core hold.
7. Strategic Recap & Forward Outlook
The tape made new highs. The bifurcation underneath is generational. The bull thesis is intact, and it is also entirely earnings-dependent over the next 72 hours.
If MSFT delivers Azure +37% or better and capex is digestible, GOOGL ratifies Cloud reacceleration with Search durability, and META shows ad-spend growth absorbing the $135B capex run-rate — the chip rally extends, the software cohort bottoms, and the indices move toward 7,300+. If any one of those three prints disappoints in capex, growth, or guidance — the sell-side desks unwind the systematic chip leverage that drove SOXX +40% in three weeks, and the corrective move starts before the FOMC even speaks.
This is not a week to press long beta. It is a week to hold high-quality positions, define risk explicitly, and allocate capital based on what the prints actually say — not what positioning hopes they say. The S&P at 20.9x forward and the VIX at 18.71 with consumer sentiment at a record low is not a setup that punishes patience. The trade is to own the names you would own anyway through April 29–May 2, with stops, with sizing, and with the discipline to add only after fundamentals confirm. Last week the pain trade was up. This week the bifurcation arrived. Next week is the verdict.
Forward Outlook — Week of April 27 – May 1, 2026
This is the single most consequential week of Q1 2026 earnings season, with five Mag 7 names, the FOMC, Q1 GDP, Core PCE, and April nonfarm payrolls all landing in a 96-hour window.
-
Monday, April 27: Q1 earnings continuing — focus on industrials and healthcare names. Light macro docket.
-
Tuesday, April 28: Conference Board Consumer Confidence (10:00 ET) — to be read alongside last week’s UMich at record lows. CAMT earnings (BMO) — first read on HBM4 inspection demand momentum.
-
Wednesday, April 29 [FOMC + Big Three Tech]: Q1 GDP Advance estimate (8:30 ET) — consensus near +1.0% annualized given the soft services PMI in March. FOMC decision (2:00 ET) — Powell’s second-to-last press conference (2:30 ET). Polymarket prices ~93% probability of no change. The press conference is the entire event. Microsoft, Alphabet, Meta, Visa, and TENB all report after the close.
-
Thursday, April 30: Core PCE for March (8:30 ET) — the Fed’s preferred inflation gauge, in the same week that headline UMich inflation expectations spiked. Initial Jobless Claims. Amazon and Apple report after the close.
-
Friday, May 1: April Nonfarm Payrolls and Unemployment Rate (8:30 ET). ISM Manufacturing (10:00 ET). RCAT prints the following Thursday, May 7 AMC — drone watchlist binary.
S&P 500 Key Levels: Support at 7,108 (Thursday’s close, the sell-the-news session), 7,000 (psychological round number), 6,950 (50-day). Resistance at 7,200 (round number / measured-move target on the breakout), 7,300 (consensus year-end levels from major sell-side strats). A clean weekly close above 7,200 with positive Mag 7 ratification opens the path higher; a 7,108 break-down on a soft Mag 7 print resets toward 7,000.
Sector Outlook: Semiconductors (SOXX) carry positive momentum into the print but at +40.4% MTD are mechanically extended. Software (IGV) is in a defensive setup; any positive AI commentary in the MSFT print could create a tactical bounce, but the structural overhang remains. Defense (KTOS, ITA) should benefit if Iran escalates or stalls; the price action this week says positioning is already long the theme. Energy equities lagged the oil rally — a tell that the market does not believe Brent at $105 is sustainable.
Disclaimer
This analysis is for informational purposes only and should not be construed as investment advice. Equity markets carry substantial risk, including the potential loss of principal. Past performance does not guarantee future results. Price targets are based on analytical frameworks and current market data but involve significant uncertainty. Always conduct your own due diligence and consult a qualified financial advisor before making investment decisions.