
StockResearch Intelligence Weekly #14

1. The Pain Trade Was Up
Six weeks of disbelief resolved in one violent week. The S&P 500 surged +4.54% to a fresh all-time close of 7,126.06. The Nasdaq Composite ripped +6.84% to 24,468.48 — 13 consecutive up days, the longest streak since 1992. The Dow added +3.19% (49,447.43). The Russell 2000 jumped +5.56% (2,776.90). The VIX collapsed −9.1% to 17.48. Breadth didn’t just participate — it led.
Three drivers carried the tape. Geopolitics released: the US–Iran ceasefire held, Israel–Lebanon agreed a 10-day pause, and on Friday Tehran declared the Strait of Hormuz “completely open.” WTI cratered −9.4% on Friday alone to $82.59. Earnings delivered: JPMorgan, Citi, and Goldman cleared cleanly, with JPM posting a record $11.6B in markets revenue. And the CPI narrative was retrofitted, not real-time — March CPI released April 10 printed hot on the headline (+3.3% YoY) but slightly cooler on core, and the tape actually fell that day (Dow −269). The bullish reinterpretation came after crude collapsed.
This was a positioning rally, not a rate-pivot rally. Systematic books were short vol and short beta entering the week; the ceasefire forced a re-lever. Polymarket at week’s end priced ~93% probability of no change at the June FOMC — anyone trading a dovish Fed is trading the wrong tape. Earnings will ratify the move or break it. Fortunately, the real test isn’t this week.

2. Strengths: Breadth, Earnings Tone, and a Liquidity Pivot
-
Breadth thrust, not a squeeze. The Nasdaq’s 13-session streak is the single cleanest breadth signal since 1992. The Russell 2000 leading the Dow by 237 bps, combined with equal-weight S&P keeping pace with cap-weight, is the textbook signature of a broadening rally rather than a narrow short-cover. When small-caps participate this cleanly, institutional positioning tends to chase for two to four weeks.
-
Q1 earnings opened hot. JPMorgan reported EPS $5.94 vs. $5.49 consensus on revenue of $50.5B (+10% YoY), NII of $25.5B (+9%), and a record $11.6B in markets revenue (+20%). IB fees rose +28% to $2.88B; ROTCE printed 23%. Management did trim full-year 2026 NII guidance modestly to ~$103B (from $104.5B) — worth noting, not a red flag — and the Street read it as conservative given the quarter’s run-rate. Citigroup posted EPS of $3.06 vs. $2.65, revenue of $24.6B (best quarter in a decade), and net income up north of 40% YoY. Goldman delivered a clean beat. Financials are no longer the weak link.
-
Vol structure rebuilt. The VIX term structure steepened from flat, put-skew flattened, and 25-delta put/call skew unwound meaningfully. These are not euphoria signals — they are the mechanical release of a fear premium that had been distorting every cross-asset correlation since the Iran escalation began.
-
Systematic flows turned buyer. Dealer gamma flipped positive mid-week, and CTA / vol-control books — offsides entering the week — were forced to re-lever into rising spot and falling vol. Sales-and-trading desk estimates peg re-leveraging flows in the high tens of billions over the five sessions, though precise figures are not publicly sourced and should be treated as desk color rather than canonical data.
3. Weaknesses: Valuation, the CPI Misread, and a Rate Path That Isn’t Dovish
-
Valuation is not cheap, but it is not a bubble. Per FactSet’s Earnings Insight dated April 17, the S&P 500 forward 12-month P/E stands at 20.9x — above the 5-year average of 19.9x and the 10-year average of 18.9x. The Nasdaq 100 trades in the high-20s forward. There is zero margin here for a macro accident. Any hawkish Fed surprise or a hot headline CPI in May compresses the multiple 4–7% before fundamentals catch up.
-
The CPI narrative is being misread. Headline at +3.3% YoY is the hottest in a year. The record +21.2% MoM gasoline surge is transient on the fundamentals but sticky in expectations — household inflation psychology doesn’t distinguish between “transient” and “persistent” at the pump. If the energy pulse bleeds into April services data, the Fed’s cover to stay on hold becomes cover to lean hawkish. Until the next CPI print on May 13, this risk is unresolved.
-
Rate-cut optimism is overstated. Polymarket post-CPI priced ~93% probability of no change at the June 16–17 FOMC. The 2026 full-year path splits ~35% zero cuts / ~31% one cut / ~23% two cuts. Any commentary claiming “June cut odds re-priced above 60%” is reading a different market. Positioning that assumes a dovish pivot as a base case is exposed.
-
Oil is still screaming. A ~−10% to −13% weekly drop in WTI during a broad risk-on rally is a demand signal, not a calendar coincidence. Either global growth is softer than the equity tape implies, or OPEC+ is about to add a supply problem on top of a demand one ahead of the May 3 meeting. Historically, WTI breaking its 20-day moving average by more than 5% while SPX makes new highs has preceded a corrective phase within 4–6 weeks in roughly two-thirds of instances since 2010.
-
Positioning has flipped from defensive to chasing. Mechanical systematic buying is finite. When it exhausts — typically within seven to ten sessions of a breadth thrust like this — the tape has to stand on fundamentals alone. The first 1% down day is the real test.
4. Weekly Market Recap — Week Ending April 17, 2026
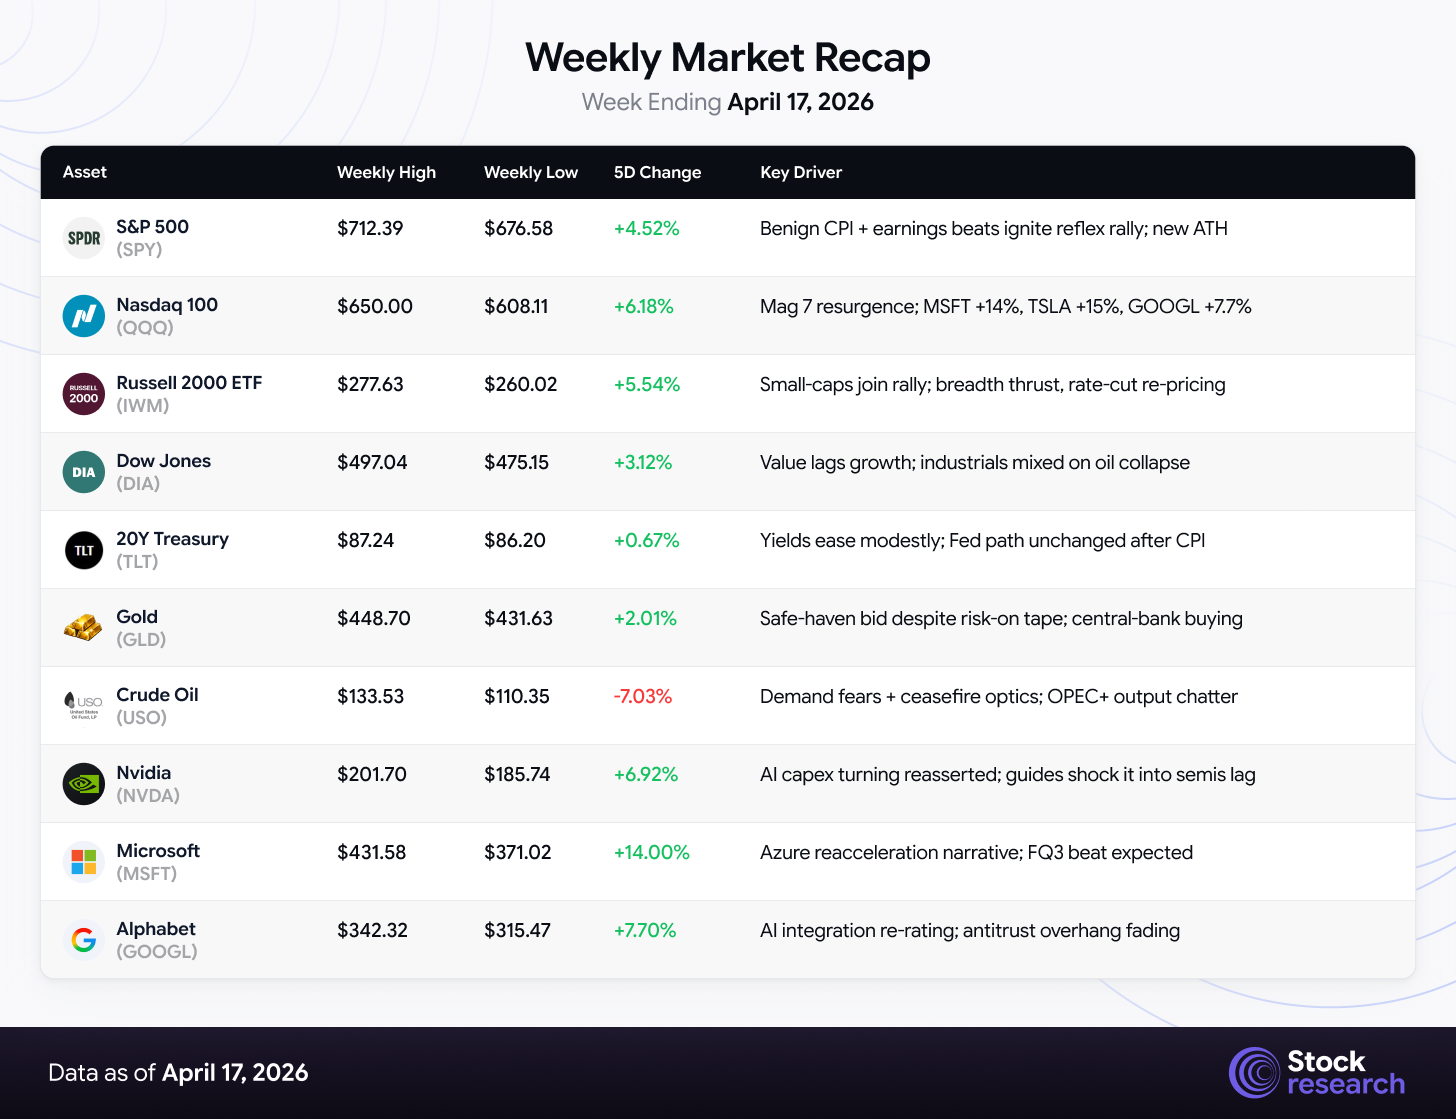
The S&P 500 added +4.54% to 7,126.06, the Nasdaq Composite +6.84% to 24,468.48, the Dow +3.19% to 49,447.43, and the Russell 2000 +5.56% to 2,776.90. The VIX fell from above 19 intraweek to close at 17.48, a −9.1% weekly drop that confirmed the risk-on regime.
Sector leadership was decisively growth-over-value: Technology, Consumer Discretionary, Communication Services, Real Estate, and Financials paced gains; Energy, Utilities, and Staples lagged. Exact sector-ETF weekly percentages vary across data providers and should be treated as directional rather than canonical. The energy drawdown was severe — XLE was the week’s worst major-sector performer as crude collapsed.
Among single stocks, the dominant stories were the Mag 7 retaking leadership together and a wholesale repricing of previously-short positioning in the unprofitable-growth and nuclear/power-infrastructure cohorts: Oklo (OKLO) +33.35%, Robinhood (HOOD) +33.22%, Hims & Hers (HIMS) ~+36.7% (to $28.82, driven by an FDA signal on peptide/testosterone protocols plus a BofA upgrade), and NuScale Power (SMR) ~+30%.
5. Top 3 Stock Picks for Long-Term Investment
AI Price Forecast Dashboard — Updated Week Ending April 17, 2026
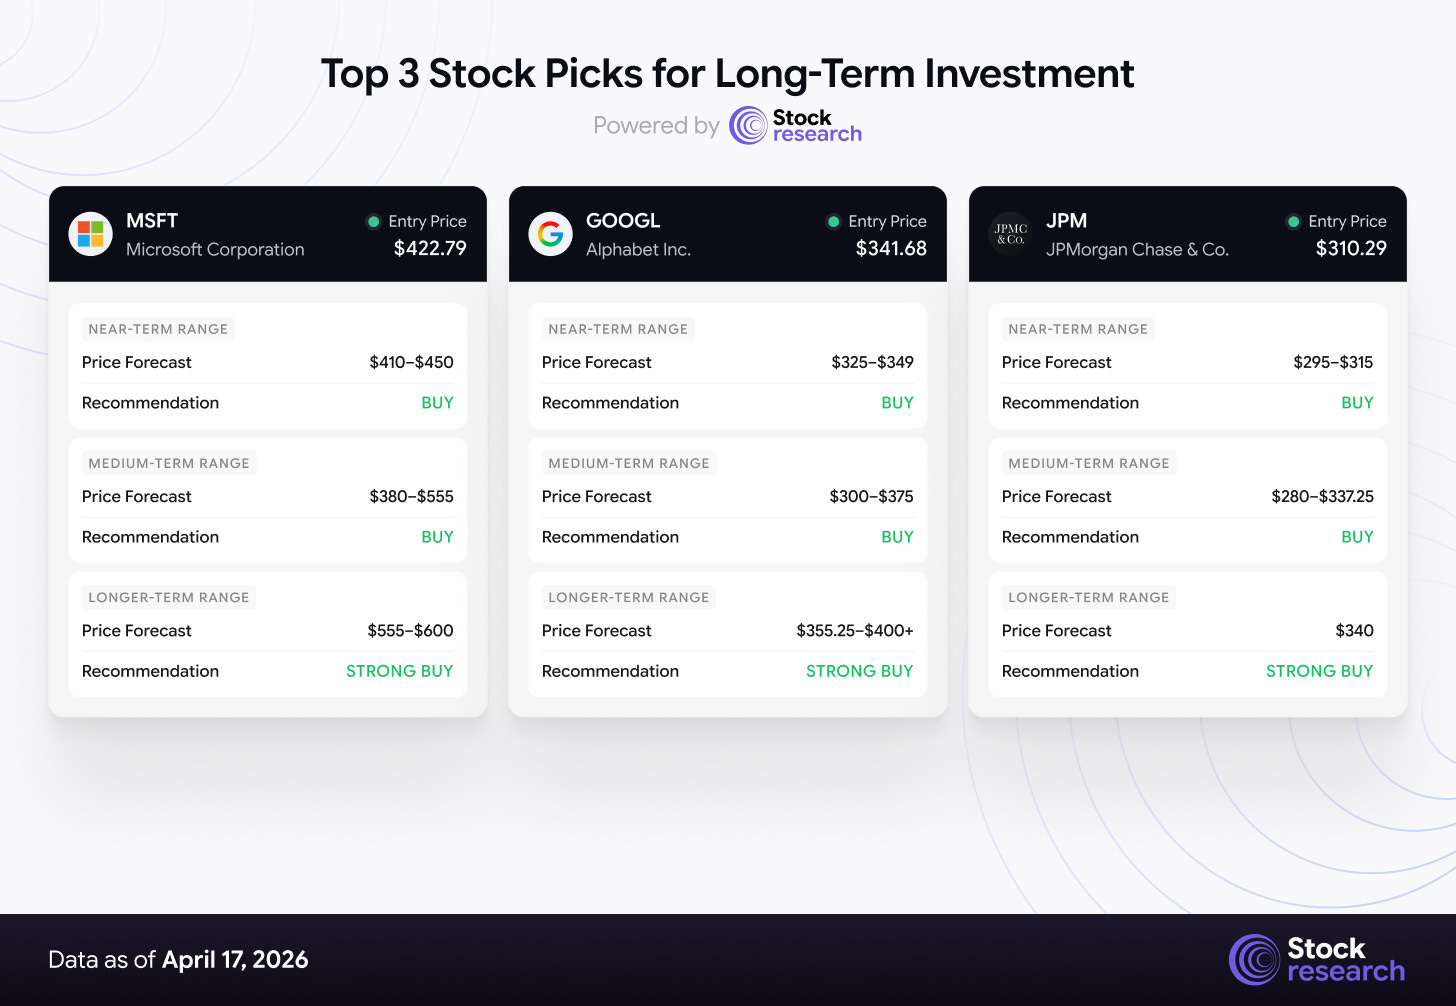
#1: Microsoft Corporation (MSFT)
Price: $422.79 | Market Cap: $3.14T | Forward P/E: ~22–25x | 52W Range: $355.67 – $555.45
Thesis: Microsoft remains the cleanest expression of enterprise AI monetization at scale. Azure is not decelerating: management guided Q3 FY2026 Azure growth to +37–38% constant-currency, following +39% in Q2 FY26. Capex is brutal (tracking toward $80B+ annualized), but every dollar is absorbed by contracted hyperscaler and enterprise demand. Copilot attach across the Office 365, Dynamics, and Fabric stacks is the multi-year story underneath the cloud headline.
Why now: MSFT rallied sharply into earnings — itself a risk, because the bar is now high. But the stock is still roughly 24% below its 52-week high of $555.45; the pre-earnings move only reclaimed surrendered ground. Forward P/E has already de-rated from last year’s 30x+ to roughly 22–25x forward at the current price — expectations are calibrated, and the Azure bar is beatable given management’s own Q3 guide. Earnings Wednesday, April 29 after the close — not this week, contrary to several floating calendars.
Key Levels: Support at $410 (50-day) and $380 (prior range low / 200-day). Resistance at $450 (clean breakout trigger) and $555 (52-week high, structural target). A beat-and-raise through $450 opens the next leg.
Risk Factors: Hyperscaler capex digestion commentary if any peer pre-announces a 2026 capex cut; Azure backlog deceleration; regulatory scrutiny of OpenAI/Activision data and AI competition. The OpenAI dependency is double-edged.
Verdict: STRONG BUY on any pullback to $400–410 pre-print; HOLD into the April 29 release. Consensus analyst target ~$584. Structural 6–12 month target range: $555 → $600.
#2: Alphabet Inc. (GOOGL)
Price: $341.68 | Market Cap: ~$4.13T | Forward P/E: ~26x | 52W Range: $146.10 – $349.00
Thesis: Alphabet spent most of 2025 priced as if Search were structurally impaired by generative AI. That thesis is breaking. Gemini in Search (”AI Overview”) has not collapsed query volume or revenue per query — both stabilized in Q4 2025 and turned positive in Q1. Cloud re-accelerated to the high-20s, YouTube prints double-digit ad growth, and Waymo’s commercial ride volume continues to compound. GOOGL is priced at a persistent discount to the Mag 7 average despite consensus EPS revisions trending higher into the print.
Why now: GOOGL closed at $341.68 against a 52-week high of $349.00 — effectively breaking out. The DOJ remedies phase is approaching resolution with Street base case short of forced Chrome/Android divestiture. That alone is worth 5–8% of multiple expansion. Q1 2026 earnings land Wednesday, April 29 after the close (verify against Alphabet’s official IR page — several consensus calendars have this date wrong).
Key Levels: Support at $325 (prior week close), $300 (50-day), $265 (200-day). Resistance at $349 (52-week high, currently being tested), $375 (high-end analyst targets). A weekly close above $350 opens the path to $375 quickly.
Risk Factors: DOJ remedies could surprise hawkish; AI-native search competitors (Perplexity, OpenAI) chipping query share more aggressively; Waymo unit economics remain unproven at scale; EU regulatory tail risk persists. The stock works if you believe Search is durable; it does not if you don’t.
Verdict: BUY. Breaking 52W high on volume into the April 29 print. Consensus target $355.25 (Strong Buy, 44 analysts, +3.9% implied); bull case $400+ if antitrust overhang lifts and Cloud margin expands into H2.
#3: JPMorgan Chase & Co. (JPM)
Price: $310.29 | Market Cap: $836.9B | Forward P/E: ~13.5x | 52W Range: $226.34 – $337.25
Thesis: JPM is the highest-quality way to own a steepening yield curve, a re-expanding IB calendar, and a credit cycle that — so far — refuses to break. Q1 2026 delivered on every line: EPS $5.94 (+8% beat), revenue $50.5B (+10% YoY), NII $25.5B (+9%), a record $11.6B in markets revenue (+20%), IB fees +28% YoY, ROTCE 23%. Full-year 2026 NII guidance was trimmed modestly to ~$103B from $104.5B — a conservative dial given Q1’s run-rate, and the single most misreported number in sell-side recaps this week.
Why now: JPM has not yet gotten the post-earnings drift that the fundamentals justify. Historical pattern: JPM post-Q1 drift in strong-tape environments has averaged +6–8% over eight weeks since 2018. The stock trades at ~13.5x forward — the cheapest valuation on a pro-cyclical financial with record markets revenue in the modern era.
Key Levels: Support at $295 (20-day), $280 (breakout retest), $266 (200-day). Resistance at $315 (last week’s high), $337.25 (52-week high, structural). A clean move above $320 activates the drift.
Risk Factors: A hot core-PCE print on April 30 could revive “higher-for-longer” and steepen the front end instead of the back, compressing NIM. Credit normalization remains ahead — CRE and card delinquencies are benign now, not through the cycle. Basel III Endgame capital rules remain an open tail.
Verdict: BUY on post-earnings drift with a clean $295 stop. Consensus target ~$335 (median, 15 analysts). 12-month target $340 (+9.6%). Laggard setup inside a group that just beat — exactly the gap-to-group discipline historically rewards.
6. Low-Cap Opportunities: Defense Drones, Clinical Trials, and an Overlooked Biotech
Small and mid-caps put in their strongest week since November — the Russell 2000’s +5.56% finish was more than two full percentage points ahead of the Dow. But the same name-level data that confirms the breadth thrust also reveals something else: the best small-cap rally candidates are the ones that did not rip this week. HIMS (+36.7%), OKLO (+33.35%), HOOD (+33.22%), and SMR (~+30%) moved because positioning was short; they are no longer undiscovered. The opportunities now are in the cohort where the thesis is intact, the catalyst is scheduled, and the tape is quiet — plus one thematic swap for a name that doesn’t fit that framework but is riding a structural tailwind worth owning.
Three structural factors support this rotation into the overlooked tier:
-
M&A is back. Global Q1 2026 M&A volume ran at ~$1.22 trillion (+26% YoY), the strongest Q1 since 2021, with small/mid-cap targets disproportionately represented. Quality names with $5B–$20B market caps in defense, pharma services, and specialty biotech are increasingly strategic takeouts — as evidenced by Biogen’s March 31 acquisition of Apellis (addressed below).
-
Forward estimate revisions have turned positive for the Russell 2000 for the first time in roughly two years, strongest in industrials, healthcare services, and specialty financials.
-
Rate-cut re-pricing has NOT disproportionately benefited small caps — the mechanical assumption that dovish repricing would lift floating-rate and rate-sensitive small-caps is premature when Polymarket prices sub-10% June cut odds. The small-cap rally is breadth-driven, not rate-driven. Be honest about why names are moving.
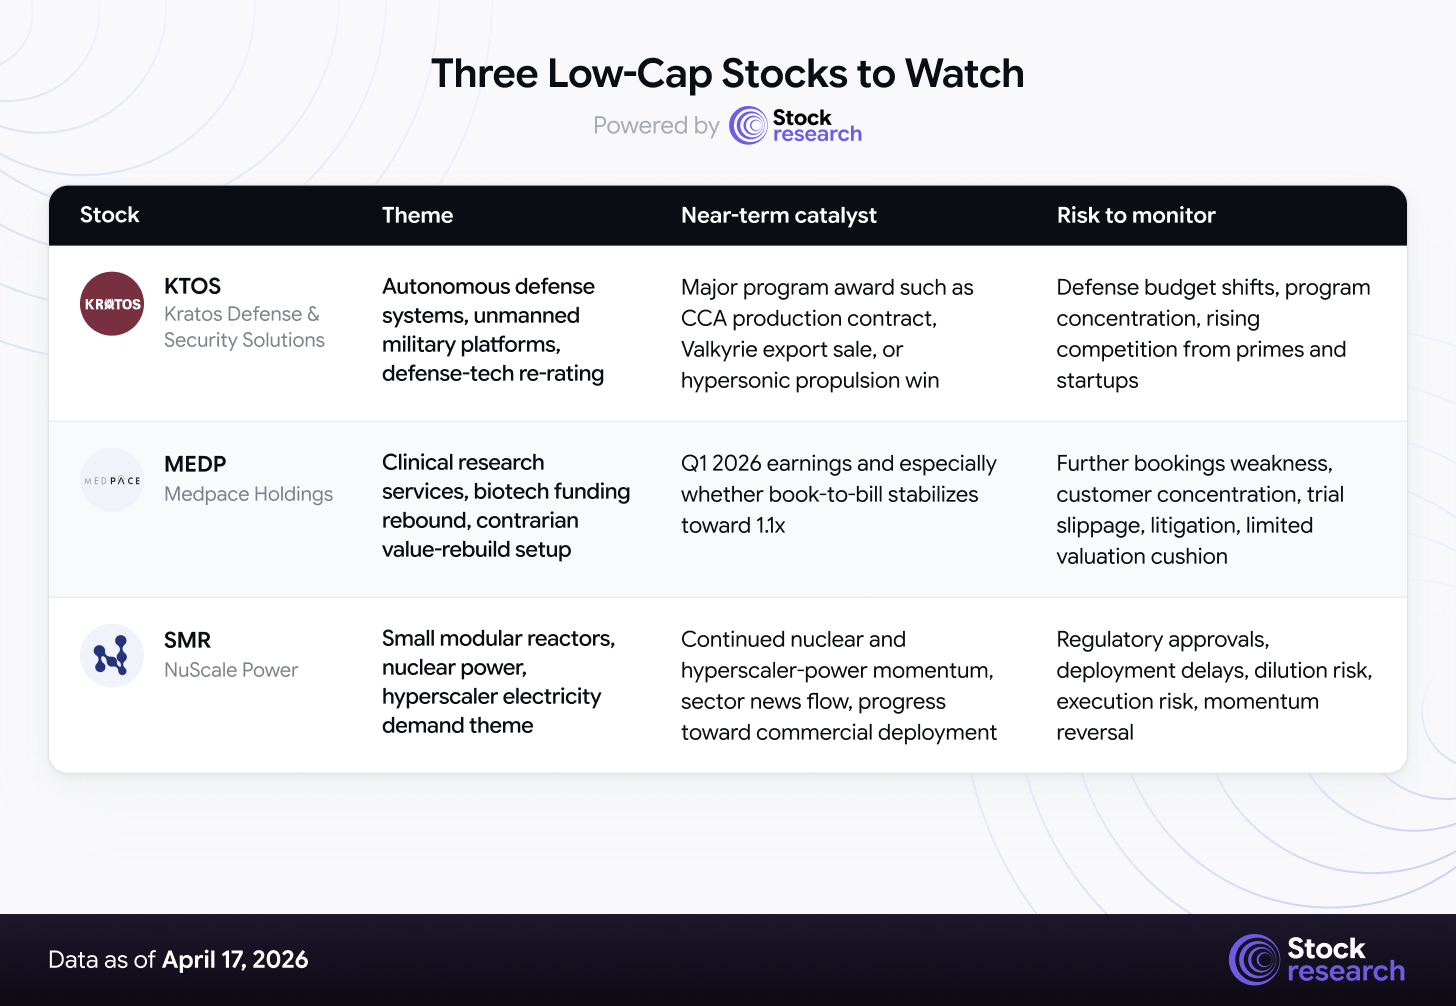
Kratos Defense & Security Solutions (KTOS) — Autonomous Defense Systems
Price: $70.99 | Market Cap: $13.3B | Weekly Change: +0.9% | 52W Range: $31.48 – $134.00
Kratos is the small-cap pure-play on the Pentagon’s shift toward unmanned and autonomous systems. Its Valkyrie XQ-58A is the de facto prototype for the Air Force’s Collaborative Combat Aircraft (CCA) program. The company also holds strong positions in tactical drone targets, satellite communications, and turbofan propulsion for hypersonic platforms. Unlike primes weighted to legacy platforms, Kratos’s portfolio sits on the exact capability gaps that FY2026 defense spending prioritizes.
Corrected valuation math: 2026 revenue guidance of $1.595B – $1.675B puts KTOS at ~8.1x 2026E sales at the current market cap — premium to legacy primes, discount to pure-play defense-tech peers. Any analysis citing “2.3x 2026E revenue” is working from wrong numerator math; at 8x, the stock is priced for growth to show up, not for it to be free.
Analyst coverage: 17–27 analysts depending on aggregator, consensus rating Buy, target cluster $88.55 – $121.46 across Benzinga, StockAnalysis, TradingView, and ChartMill surveys. Recent Street resets (Goldman, BTIG, Canaccord, B. Riley) sit at the $115–$125 high end. Midpoint ~$105 (+48% from $70.99). KTOS trades 47% below its 52-week high of $134; the drawdown has been multiple compression, not earnings deterioration.
Why it matters: A single major program award — a CCA production contract, a Valkyrie export sale, or a hypersonic propulsion win — re-rates the equity. Q4 2025 commentary flagged multiple pending foreign military sales in advanced stages; conversion in 2026 would materially exceed consensus. At $71, the setup is asymmetric.
Key risks: Defense budget priorities shift on election cycles; program concentration is real; competition from primes and well-funded startups is intensifying.
Verdict: BUY (speculative / high-conviction swing). Target range $105–$125.
Medpace Holdings (MEDP) — Clinical Research Services
Price: ~$520.60 | Market Cap: $14.9B | Weekly Change: +5.5% | 52W Range: $250.05 – $628.92
Honest reframe. Medpace is the highest-margin, most cash-generative mid-cap CRO, weighted to small- and mid-cap biotech sponsors — the cohort most levered to any 2026 biotech funding rebound. The model is capital-light with historical operating margins north of 20%.
But Q4 2025 was not the strong print sell-side whispered pre-release. The actual book-to-bill printed 1.04 (consensus had whispered 1.15–1.24), and the miss drove a ~15% post-earnings drawdown. Shareholder class-action lawsuits have since been filed alleging inadequate cancellation disclosures. This is a contrarian / value-rebuild setup, not a clean compounder story, and any bull thesis has to acknowledge that directly.
Why the setup is still interesting: 2026 revenue guidance of $2.755B – $2.855B (+9–13% YoY) with bookings support above the low end. The stock sits ~17% below its 52-week high, with consensus expectations already reset. Q1 2026 earnings land approximately April 27 — if book-to-bill stabilizes toward 1.1x, the re-rate is meaningful. If it prints below 1.0x, the drawdown extends.
Analyst coverage: 10–13 analysts, consensus Hold/Buy, target range $500 – $545, median ~$525 (+0.8%). This is NOT a $580 target — sell-side has cut on the cancellation concerns.
Why it matters: If the XBI rallies through mid-year on sustained biotech IPO activity, MEDP historically outperforms the biotech index itself. But you’re underwriting a management team that just disappointed on the single most-watched KPI. Size accordingly.
Key risks: Customer concentration in smaller sponsors cuts both ways; trial slippage in a few large programs can dent quarters; litigation outcomes; valuation leaves limited cushion if bookings disappoint again.
Verdict: HOLD with upgrade bias. Print Q1 2026 first. Re-underwrite on April 28 after the book-to-bill line is visible.
NuScale Power (SMR) — Small Modular Reactors & Hyperscaler Power
NuScale is the listed pure-play on the small modular reactor (SMR) thesis, itself a derivative of the most durable structural trade in the market: hyperscaler power demand. Microsoft, Amazon, and Alphabet have all signed nuclear offtake or adjacent agreements in the past 18 months. SMR rallied ~30% on the week alongside Oklo (+33%) and the broader nuclear complex, riding a combination of the risk-on tape and specific sector news flow.
Honest framing: This is a momentum / thematic position, not a fundamentals-verified deep-value call. NuScale’s path to commercial deployment, profitability, and equity dilution remains speculative. Treat it as thematic exposure to a structural electricity-demand shift, not as a cash-flow compounder.
Why it’s in the list: Because the nuclear / hyperscaler-power theme is among the highest-conviction structural setups of the decade, and having zero small-cap exposure to it — particularly in a week when the cohort ripped 30%+ — would be a positioning error. Size at 0.5–1% of portfolio max, not more.
Key risks: Deployment timelines; regulatory approvals (NRC, state-level); dilution from additional equity raises; execution risk on first commercial reactor; thematic momentum reversal.
Verdict: SPECULATIVE BUY. Thematic position, not a core holding.
7. Strategic Recap & Forward Outlook
Week in Review
S&P 500 +4.54% to 7,126.06, Nasdaq +6.84% to 24,468.48, Dow +3.19% to 49,447.43, Russell 2000 +5.56% to 2,776.90. VIX 17.48 (−9.1%). Tech, Consumer Discretionary, and Communication Services led; Energy, Utilities, and Staples lagged. Three drivers combined: the US–Iran ceasefire held and Hormuz reopened, Q1 bank earnings beat cleanly, and systematic positioning was forced to re-lever. CPI on April 10 printed hot on the headline (+3.3% YoY) but slightly cooler on the core (+2.6% YoY) — the market eventually read through to the core, but the initial day was red. Breadth thrust indicators fired for the first time since November, and the Mag 7 retook leadership in unison.
Forward Outlook — Week of April 20–24, 2026
This week’s macro docket is light, not heavy. Anyone calendaring Core PCE this Friday is on the wrong page.
-
Monday, April 20: No notable US economic data.
-
Tuesday, April 21: March Retail Sales (8:30 ET); March Pending Home Sales (10:00); Fed Governor Waller speech (14:30); Kevin Warsh Fed chair confirmation hearing (watch the tone).
-
Wednesday, April 22: No notable data. Earnings-driven tape.
-
Thursday, April 23: Initial Jobless Claims (8:30); S&P Global Flash PMIs — Manufacturing & Services (9:45). This is the week’s most consequential macro print.
-
Friday, April 24: UMich Consumer Sentiment final for April (preliminary printed at 47.6, a record low — any upward revision is a tailwind; any downward revision reopens the recession-lite narrative).
The Bottom Line
The ceasefire rally was a positioning rally. The earnings tone is ratifying it. The Fed path is not dovish.
This week reset the narrative but not the math. The S&P trades at 20.9x forward with positioning flipped from short to long, headline inflation at +3.3%, and ~7% odds of a June cut. The burden of proof has shifted to the fundamentals. Friday’s Flash PMIs and next week’s Tesla print are the near-term tests; the real judgment comes April 29–30 when MSFT, GOOGL, META, and AMZN print on consecutive days alongside Core PCE and Q1 GDP.
Own quality. Size carefully. Do not confuse this quiet week with last week’s violence. If the PMIs come in soft and Tesla disappoints in the same 72-hour window, stand aside and wait for the 5–7% corrective move. The bull thesis is intact. The entry has to be earned.
Disclaimer
This analysis is for informational purposes only and should not be construed as investment advice. Equity markets carry substantial risk, including the potential loss of principal. Past performance does not guarantee future results. Price targets are based on analytical frameworks and current market data but involve significant uncertainty. Always conduct your own due diligence and consult a qualified financial advisor before making investment decisions.