
The Iran War & Your Portfolio

The Iran War & Your Portfolio: What History Says Happens Next
Oil surged 13% in four days. Gold broke $5,200. The VIX spiked to 27. On February 28, the U.S. and Israel launched joint strikes on Iran, killing Supreme Leader Ali Khamenei and triggering a chain of retaliatory attacks that have brought the Middle East to its most dangerous inflection point since the 1990 Gulf War.
This report breaks down exactly how markets reacted, why they moved the way they did, and, most importantly, what history says happens next.
What Happened, And Why Markets Care
On the night of February 28, 2026, U.S. and Israeli forces launched Operation Midnight Hammer, a coordinated strike campaign targeting Iranian nuclear enrichment facilities, IRGC command centers, and air defense systems. The strikes killed Supreme Leader Ali Khamenei, according to President Trump’s announcement on Truth Social, though Iranian state media initially denied this before confirming his death hours later.
Iran’s response was immediate and multi-pronged. The IRGC launched over 300 ballistic missiles and drones at Israeli population centers and U.S. military installations across the Persian Gulf. More critically for markets, the IRGC Navy announced the closure of the Strait of Hormuz to commercial shipping, a move that, if sustained, would remove approximately 20% of the world’s seaborne crude oil from the market.
This matters for one reason: energy supply. Unlike previous Iran tensions that produced threats without action, this conflict has already resulted in a measurable, physical disruption to oil transit. Tanker traffic through Hormuz dropped approximately 70% in the first 72 hours, with Lloyd’s of London immediately raising war-risk premiums for vessels transiting the Persian Gulf. Analysts at Rad Energy noted that “the immediate and most consequential development affecting markets is the effective halt of traffic through the Strait of Hormuz”.
How Markets Reacted Across Asset Classes
The best way to understand this event’s severity is to look at how every major asset class moved simultaneously. The pattern tells a clear story: markets are pricing in a genuine supply shock, not just geopolitical noise.
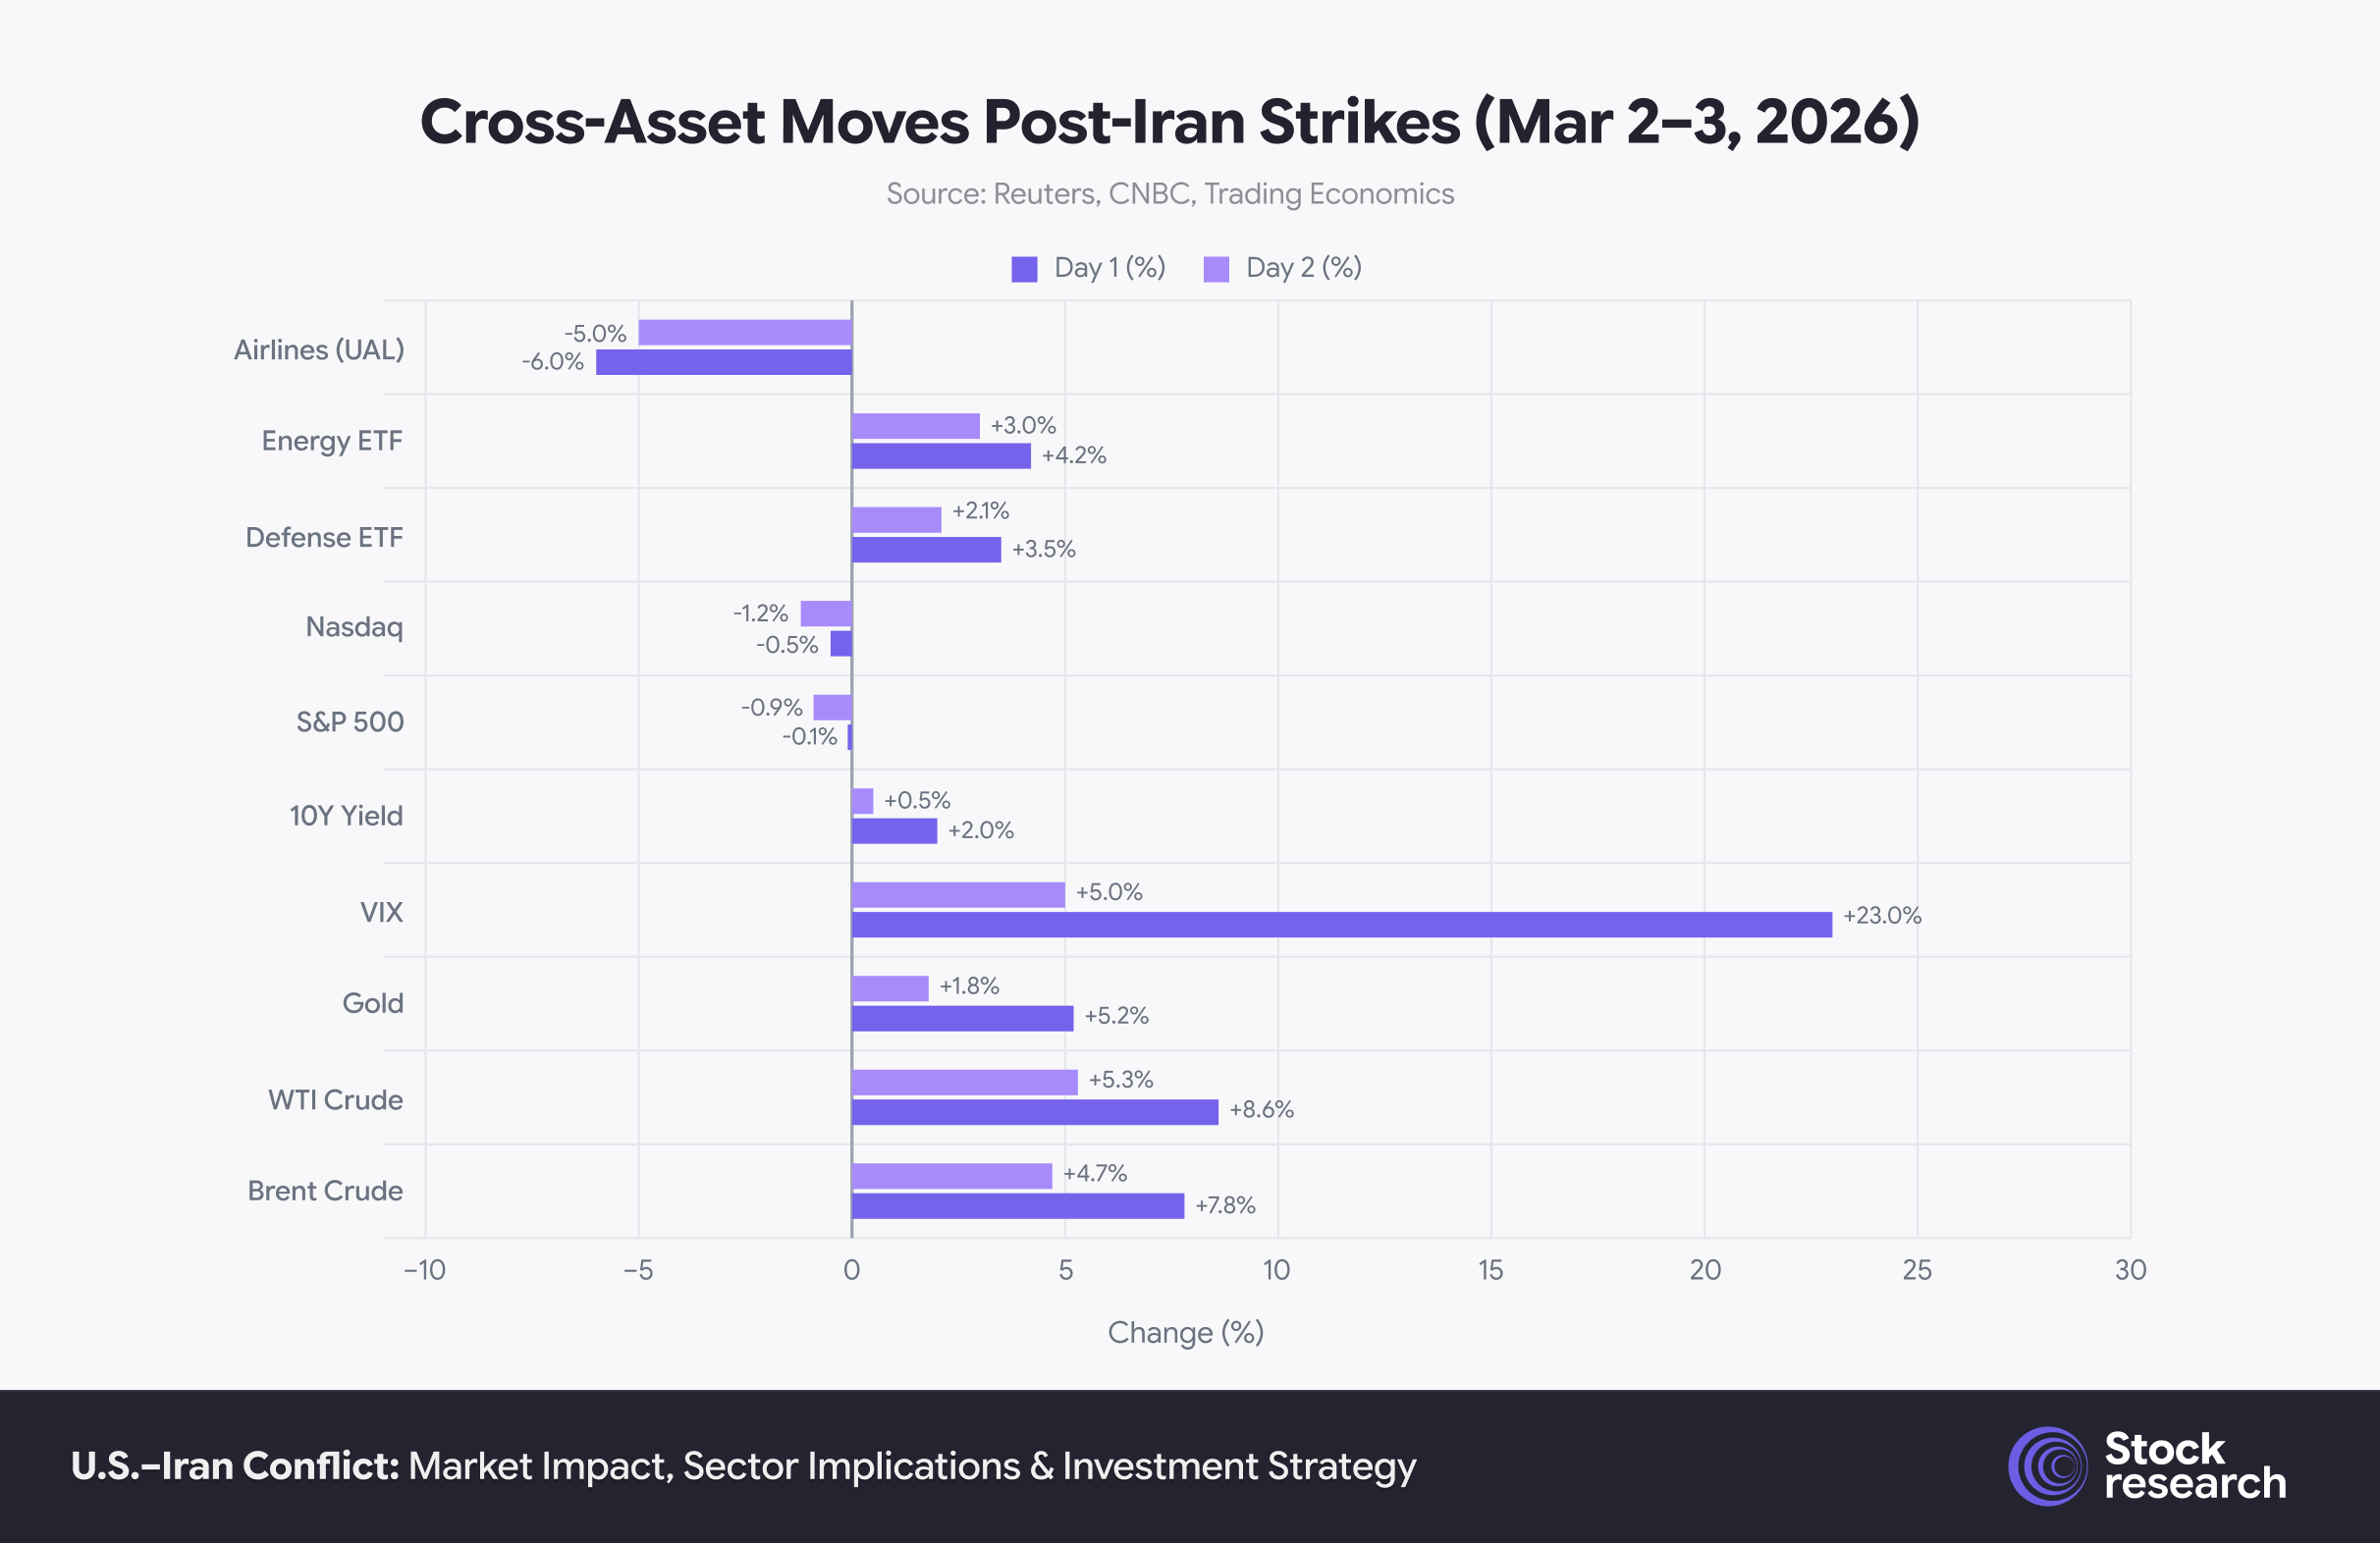
Oil and gold led the risk-on move for hard assets, while equities and airlines bore the brunt of the selloff. The VIX’s 23% Day-1 spike indicates institutional hedging activity rather than retail panic.
Oil: The Main Event
Brent crude’s move from $72.48 to $82.04 per barrel within four trading days represents a 13% surge, the sharpest oil-driven move since Russia’s invasion of Ukraine in early 2022. The initial spike was driven by the dual threat of Iranian supply being taken offline (~1.6 million bpd of exports, primarily to China) and the effective disruption of Strait of Hormuz traffic. Goldman Sachs had previously modeled a worst-case scenario of Brent reaching $110 per barrel under prolonged Hormuz closure. Oxford Economics put the tail-risk estimate even higher, at $140 per barrel under a severe disruption scenario, which it assigned a 5% probability.
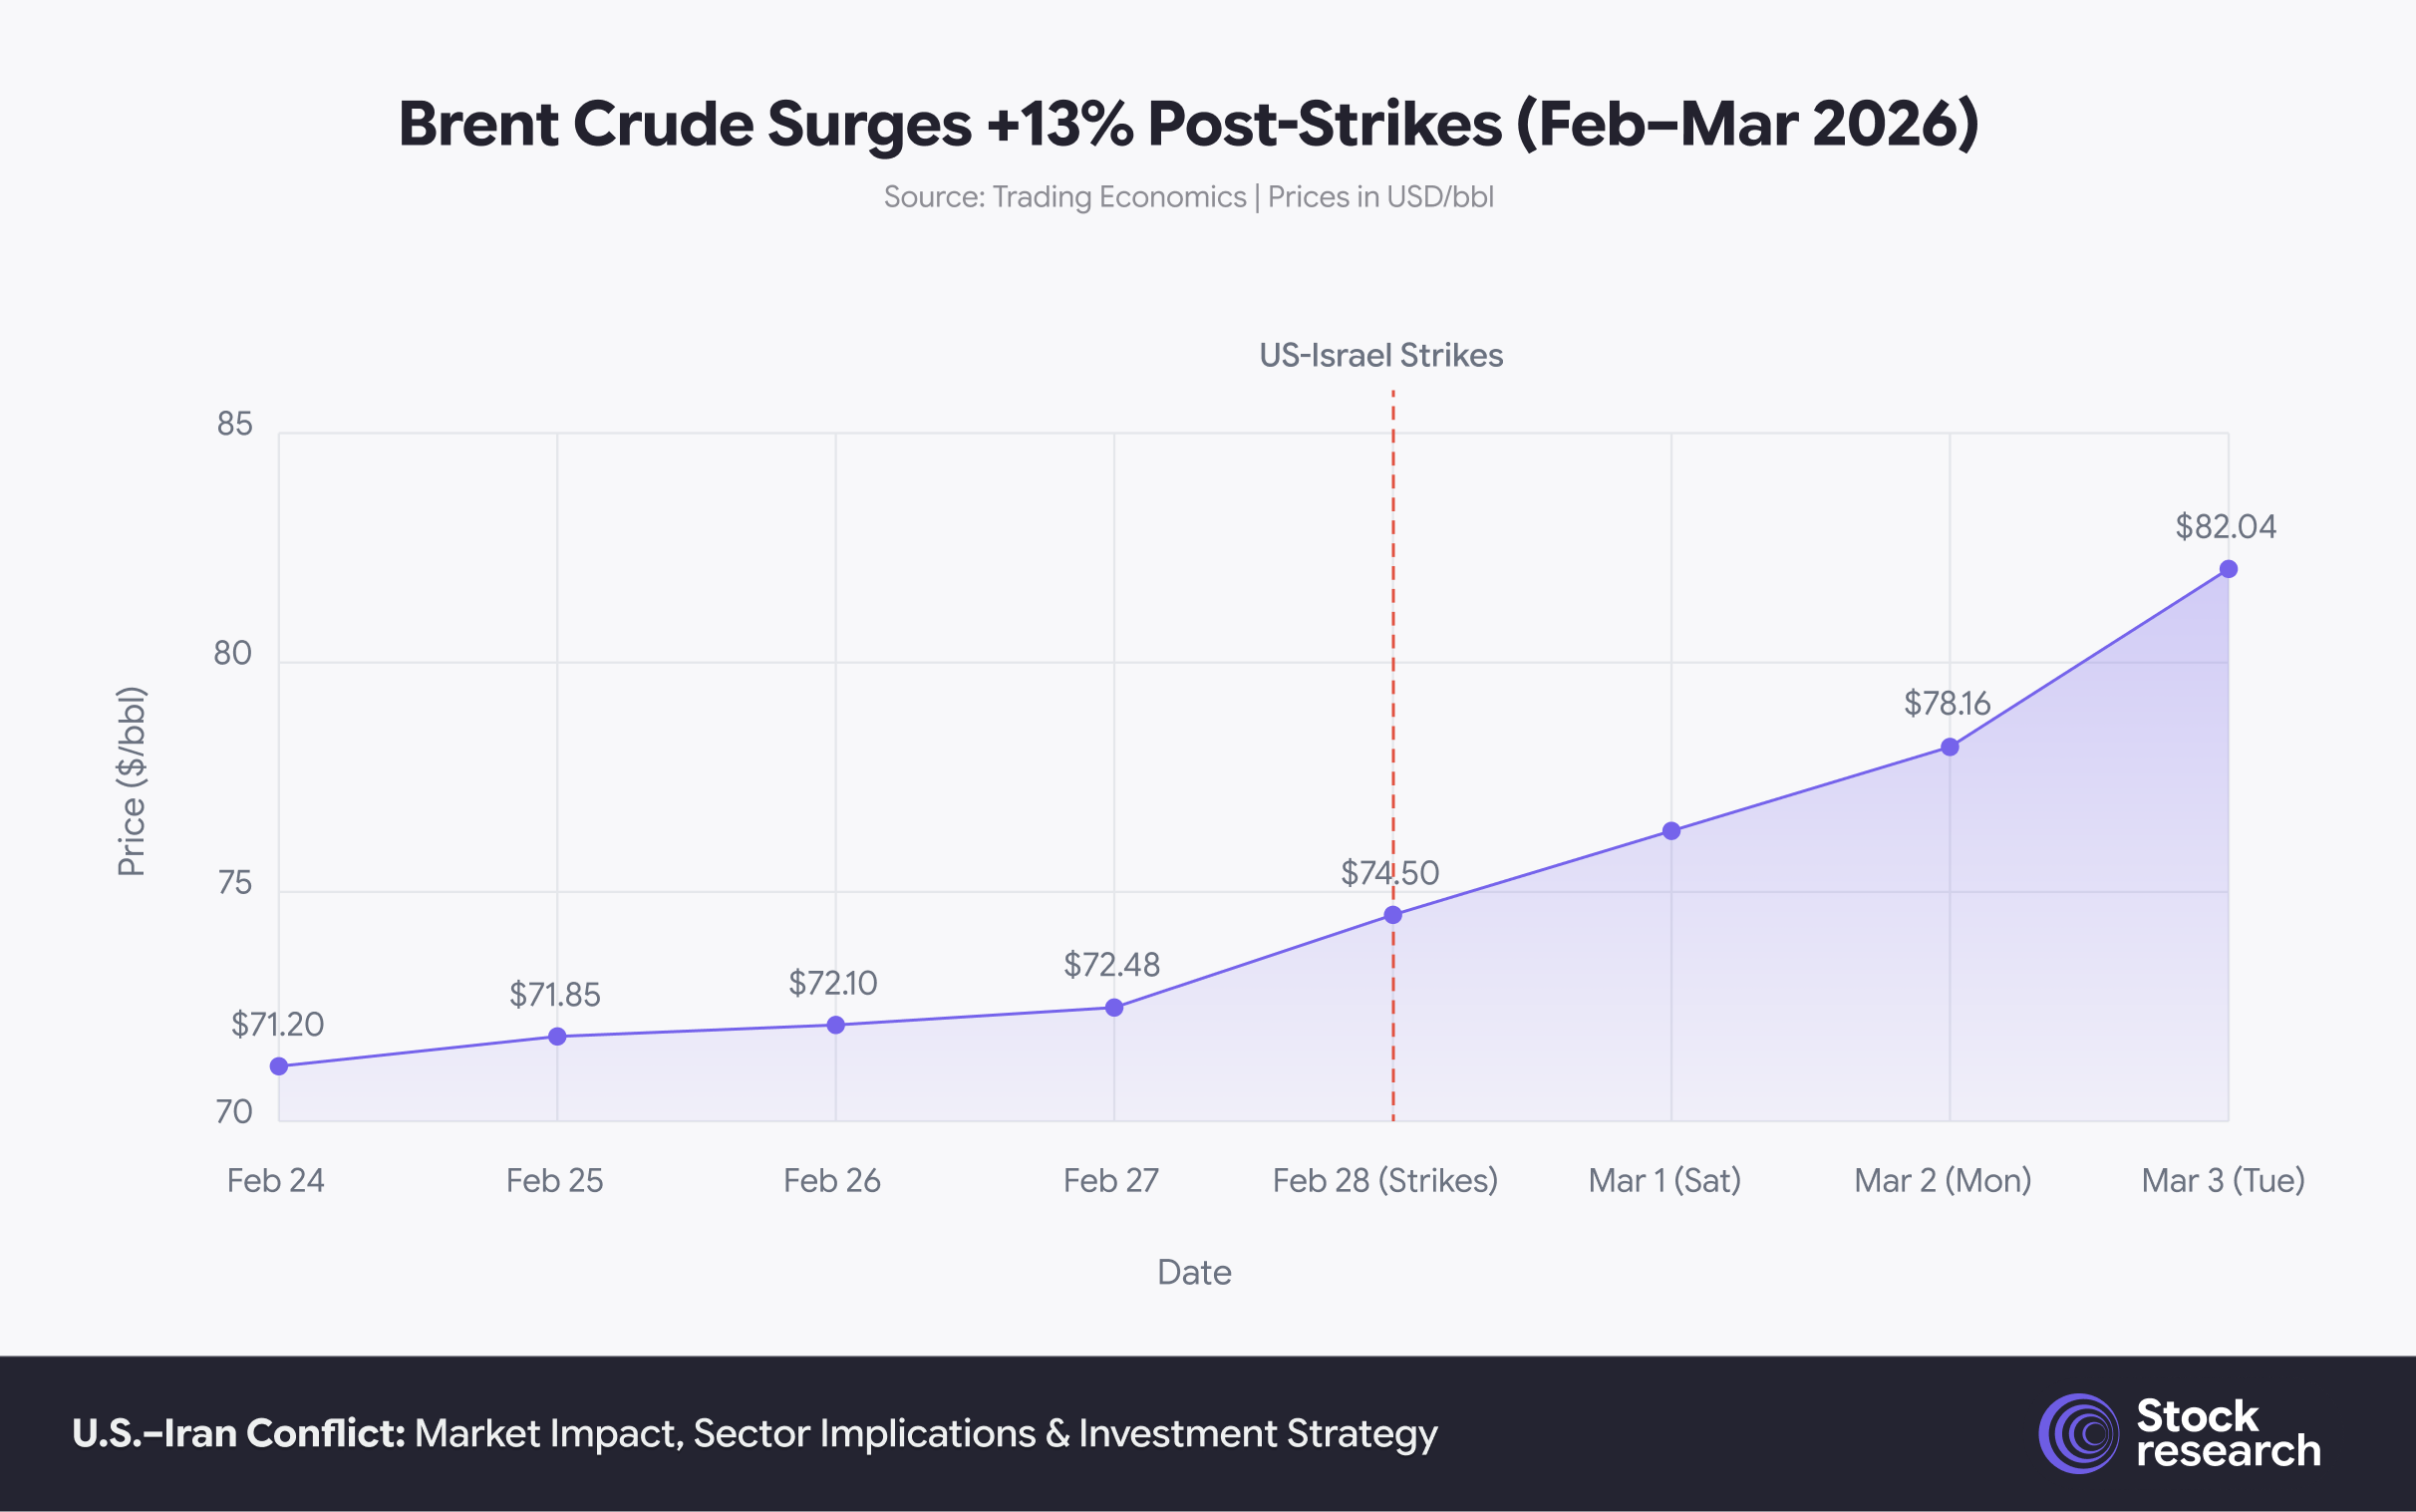
The red zone marks the onset of strikes on February 28. The price moved in a near-linear trajectory from $72.48 to $82.04, suggesting sustained institutional buying rather than a single-day panic spike.
Equities, Bonds, and Gold
The S&P 500’s response was initially measured but deteriorated as inflation concerns mounted. The index recovered from early Monday losses to close roughly flat, supported by a pattern of quick geopolitical shock absorption. However, Tuesday’s 0.9% decline, pushing the index to its lowest in over three months, signaled growing unease about the duration of the conflict. Year-to-date, the S&P 500 total return stands at -0.22%. The selloff was broad-based, with all 11 sectors declining on Tuesday, though Jefferies traders noted the selling remained “orderly” with no signs of panicked trading.
In a notable departure from typical safe-haven dynamics, Treasury yields rose rather than fell. The 10-year yield climbed 8 basis points to 4.044%, while the 2-year yield rose 10 basis points to 3.479%. This counter-intuitive move reflects a key dynamic: markets are pricing in stagflation risk, not a garden-variety flight to safety. Higher oil prices feed directly into inflation expectations, the 5-year breakeven rate jumped to 2.503%, its highest level since February 11. Reuters described Treasuries investors as “trapped in a stagflationary oil dilemma”, wanting safety but fearing the inflationary consequences.
Gold, by contrast, behaved exactly as expected. The metal surged 5.2% to $5,246 per ounce, building on a 38% rally since January 2025. Gold has now outperformed the U.S. dollar as a safe haven in every major geopolitical event since the June 2025 Israel-Iran conflict, a shift that analysts at the Canadian Mining Report attribute to growing concerns about U.S. fiscal sustainability undermining dollar credibility.
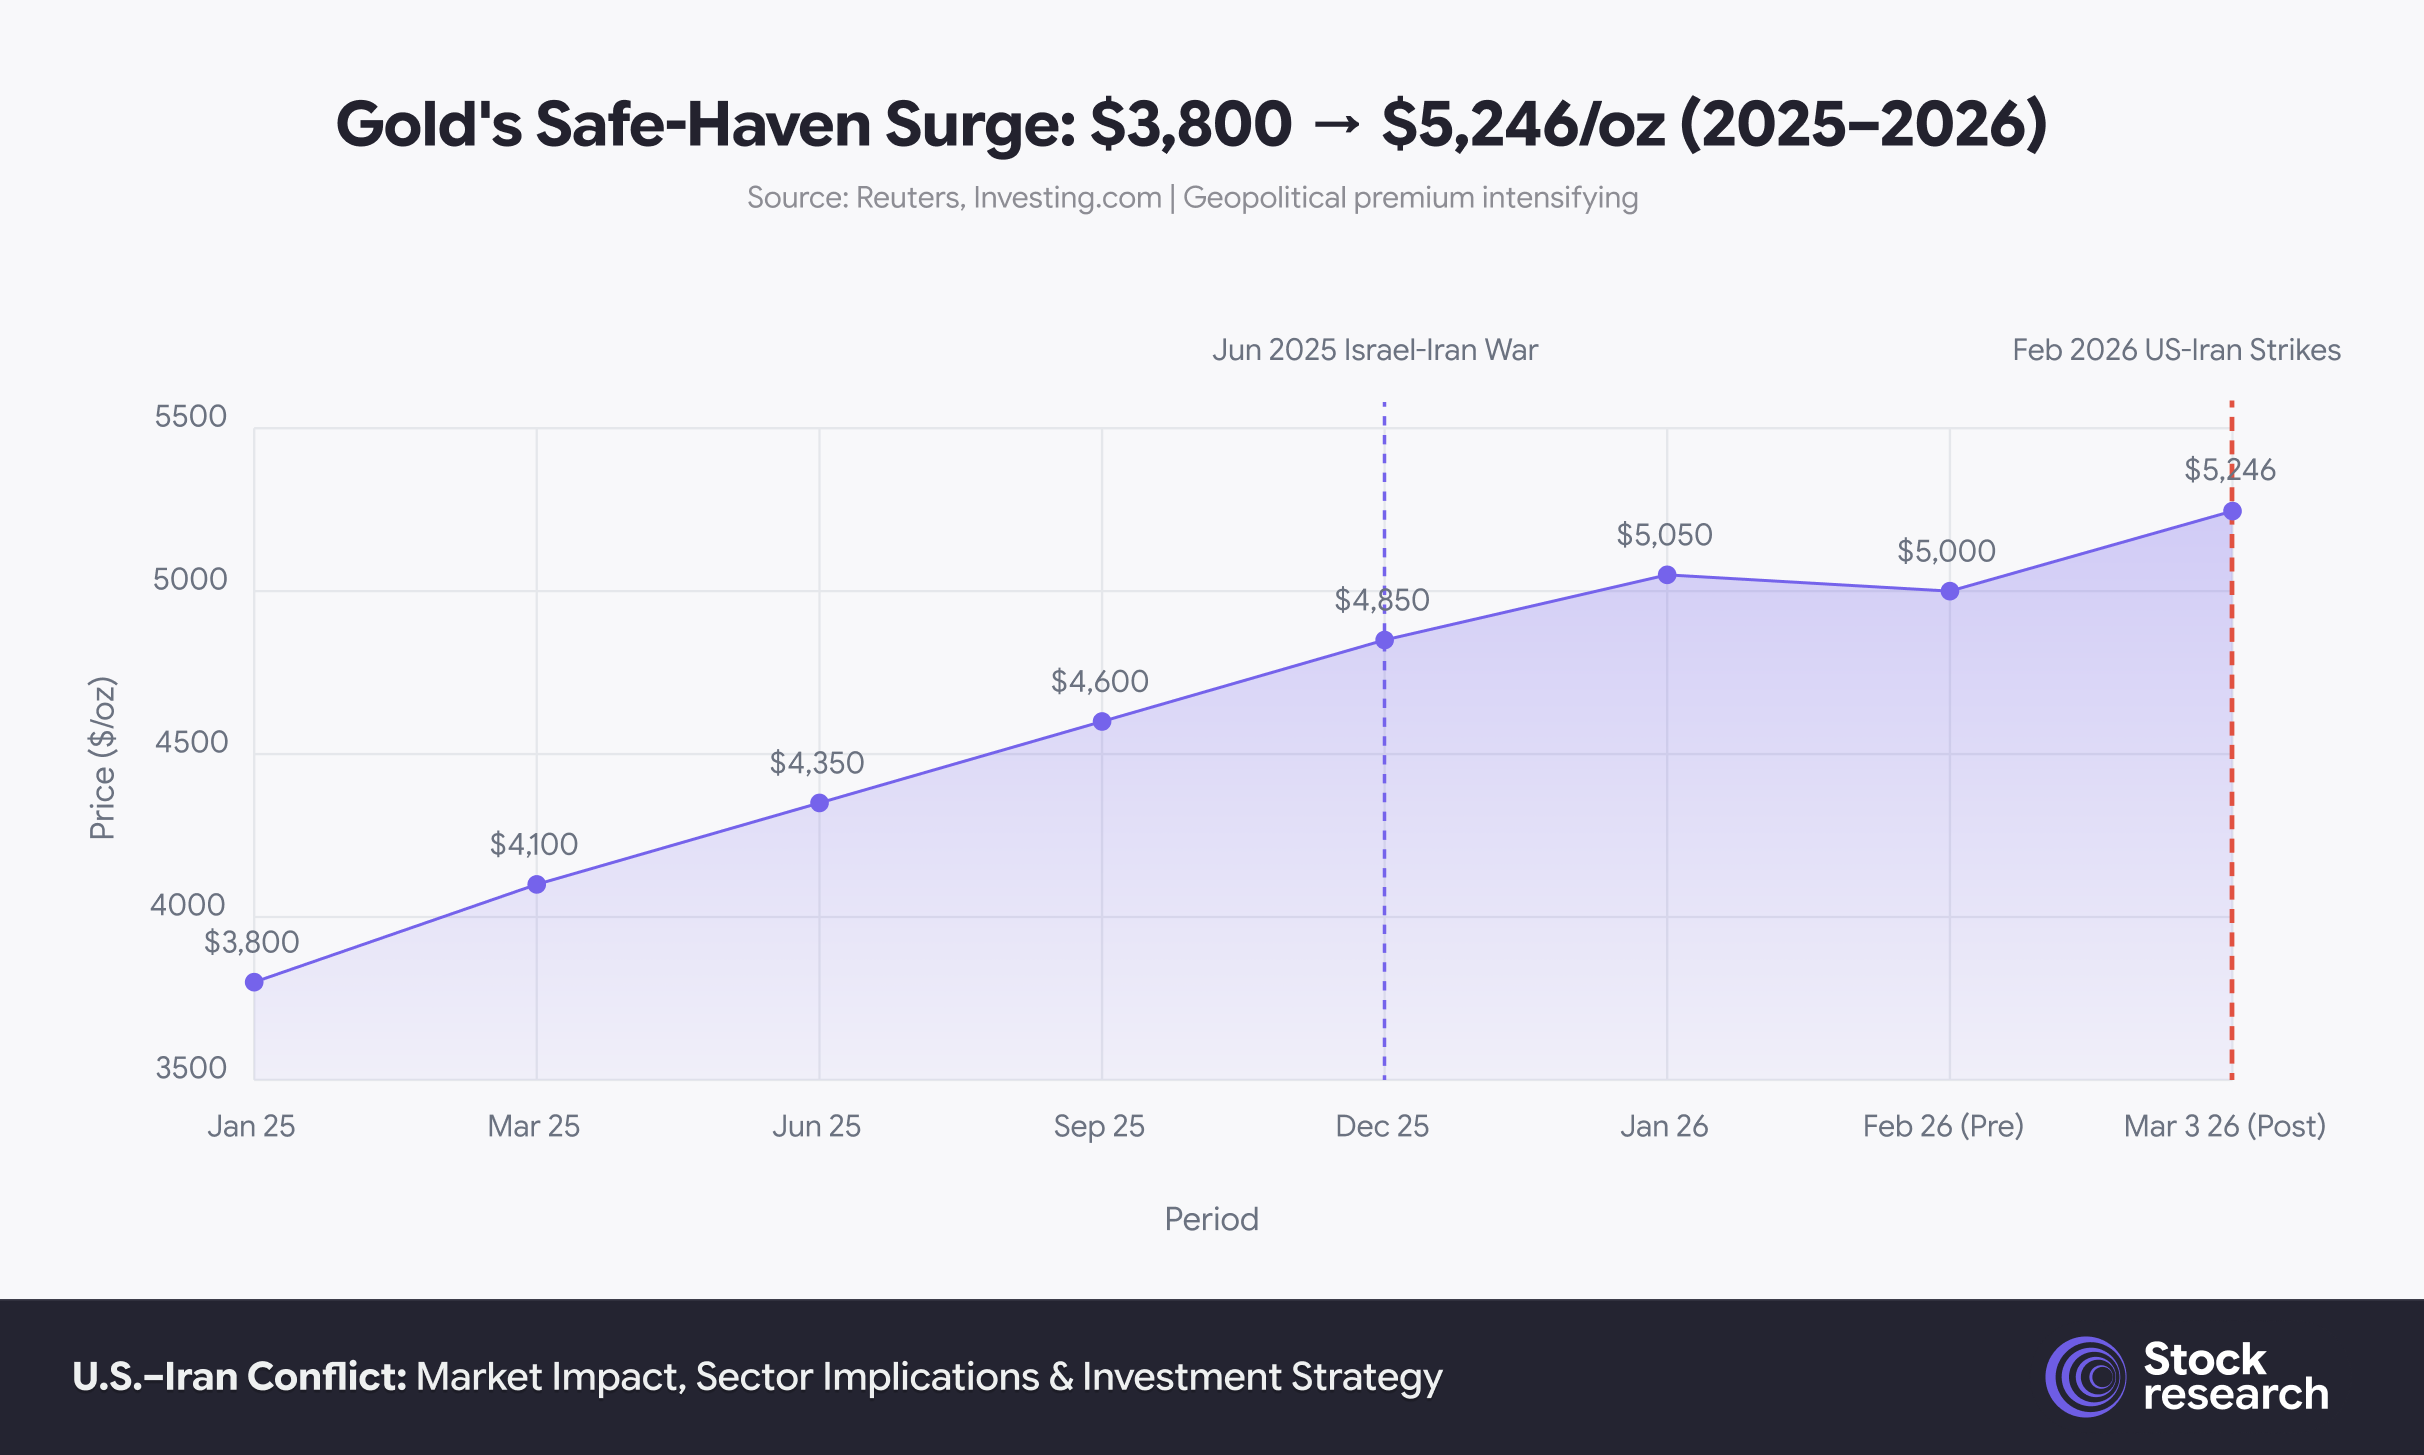
The annotated conflict milestones show gold stepping higher with each successive Middle East escalation. The metal’s 38% gain over 14 months reflects structural safe-haven reallocation, not just short-term panic buying.
What History Says: Six Shocks Compared
The Yahoo Finance analysis published on March 3 provides a valuable framework: how did oil, gold, and equities perform in the 30 days following each of the six major geopolitical shocks since 1990?
The pattern is instructive. In five of six cases, oil’s Day-1 spike partially or fully reversed within 30 days. The one exception, Kuwait 1990, is precisely the scenario that looks most analogous to today. Iraq’s invasion of Kuwait physically removed ~4.3 million bpd from the global market, and oil didn’t peak until October 1990 at nearly $40/barrel (from $21 pre-invasion). The S&P 500 ultimately fell 10% over 30 days in that episode.
The June 2025 Israel-Iran war offers a more optimistic parallel. That 12-day conflict saw oil spike 7.3% on Day 1 but end the month essentially flat (-0.6%), while the S&P 500 actually gained 5.7% over 30 days. The critical difference: that conflict never disrupted physical oil supply. Ships kept transiting Hormuz. This time, they aren’t.
The key lesson: markets can shrug off geopolitical threats. They cannot shrug off physical supply disruptions. The trajectory of this conflict will be determined not by diplomatic rhetoric but by whether tankers resume transiting the Strait of Hormuz within weeks, or months.
Sector Winners and Losers
The divergence in sector performance was immediate and severe. Defense and energy names rallied sharply, while airlines and travel stocks posted their worst single-day losses in months.
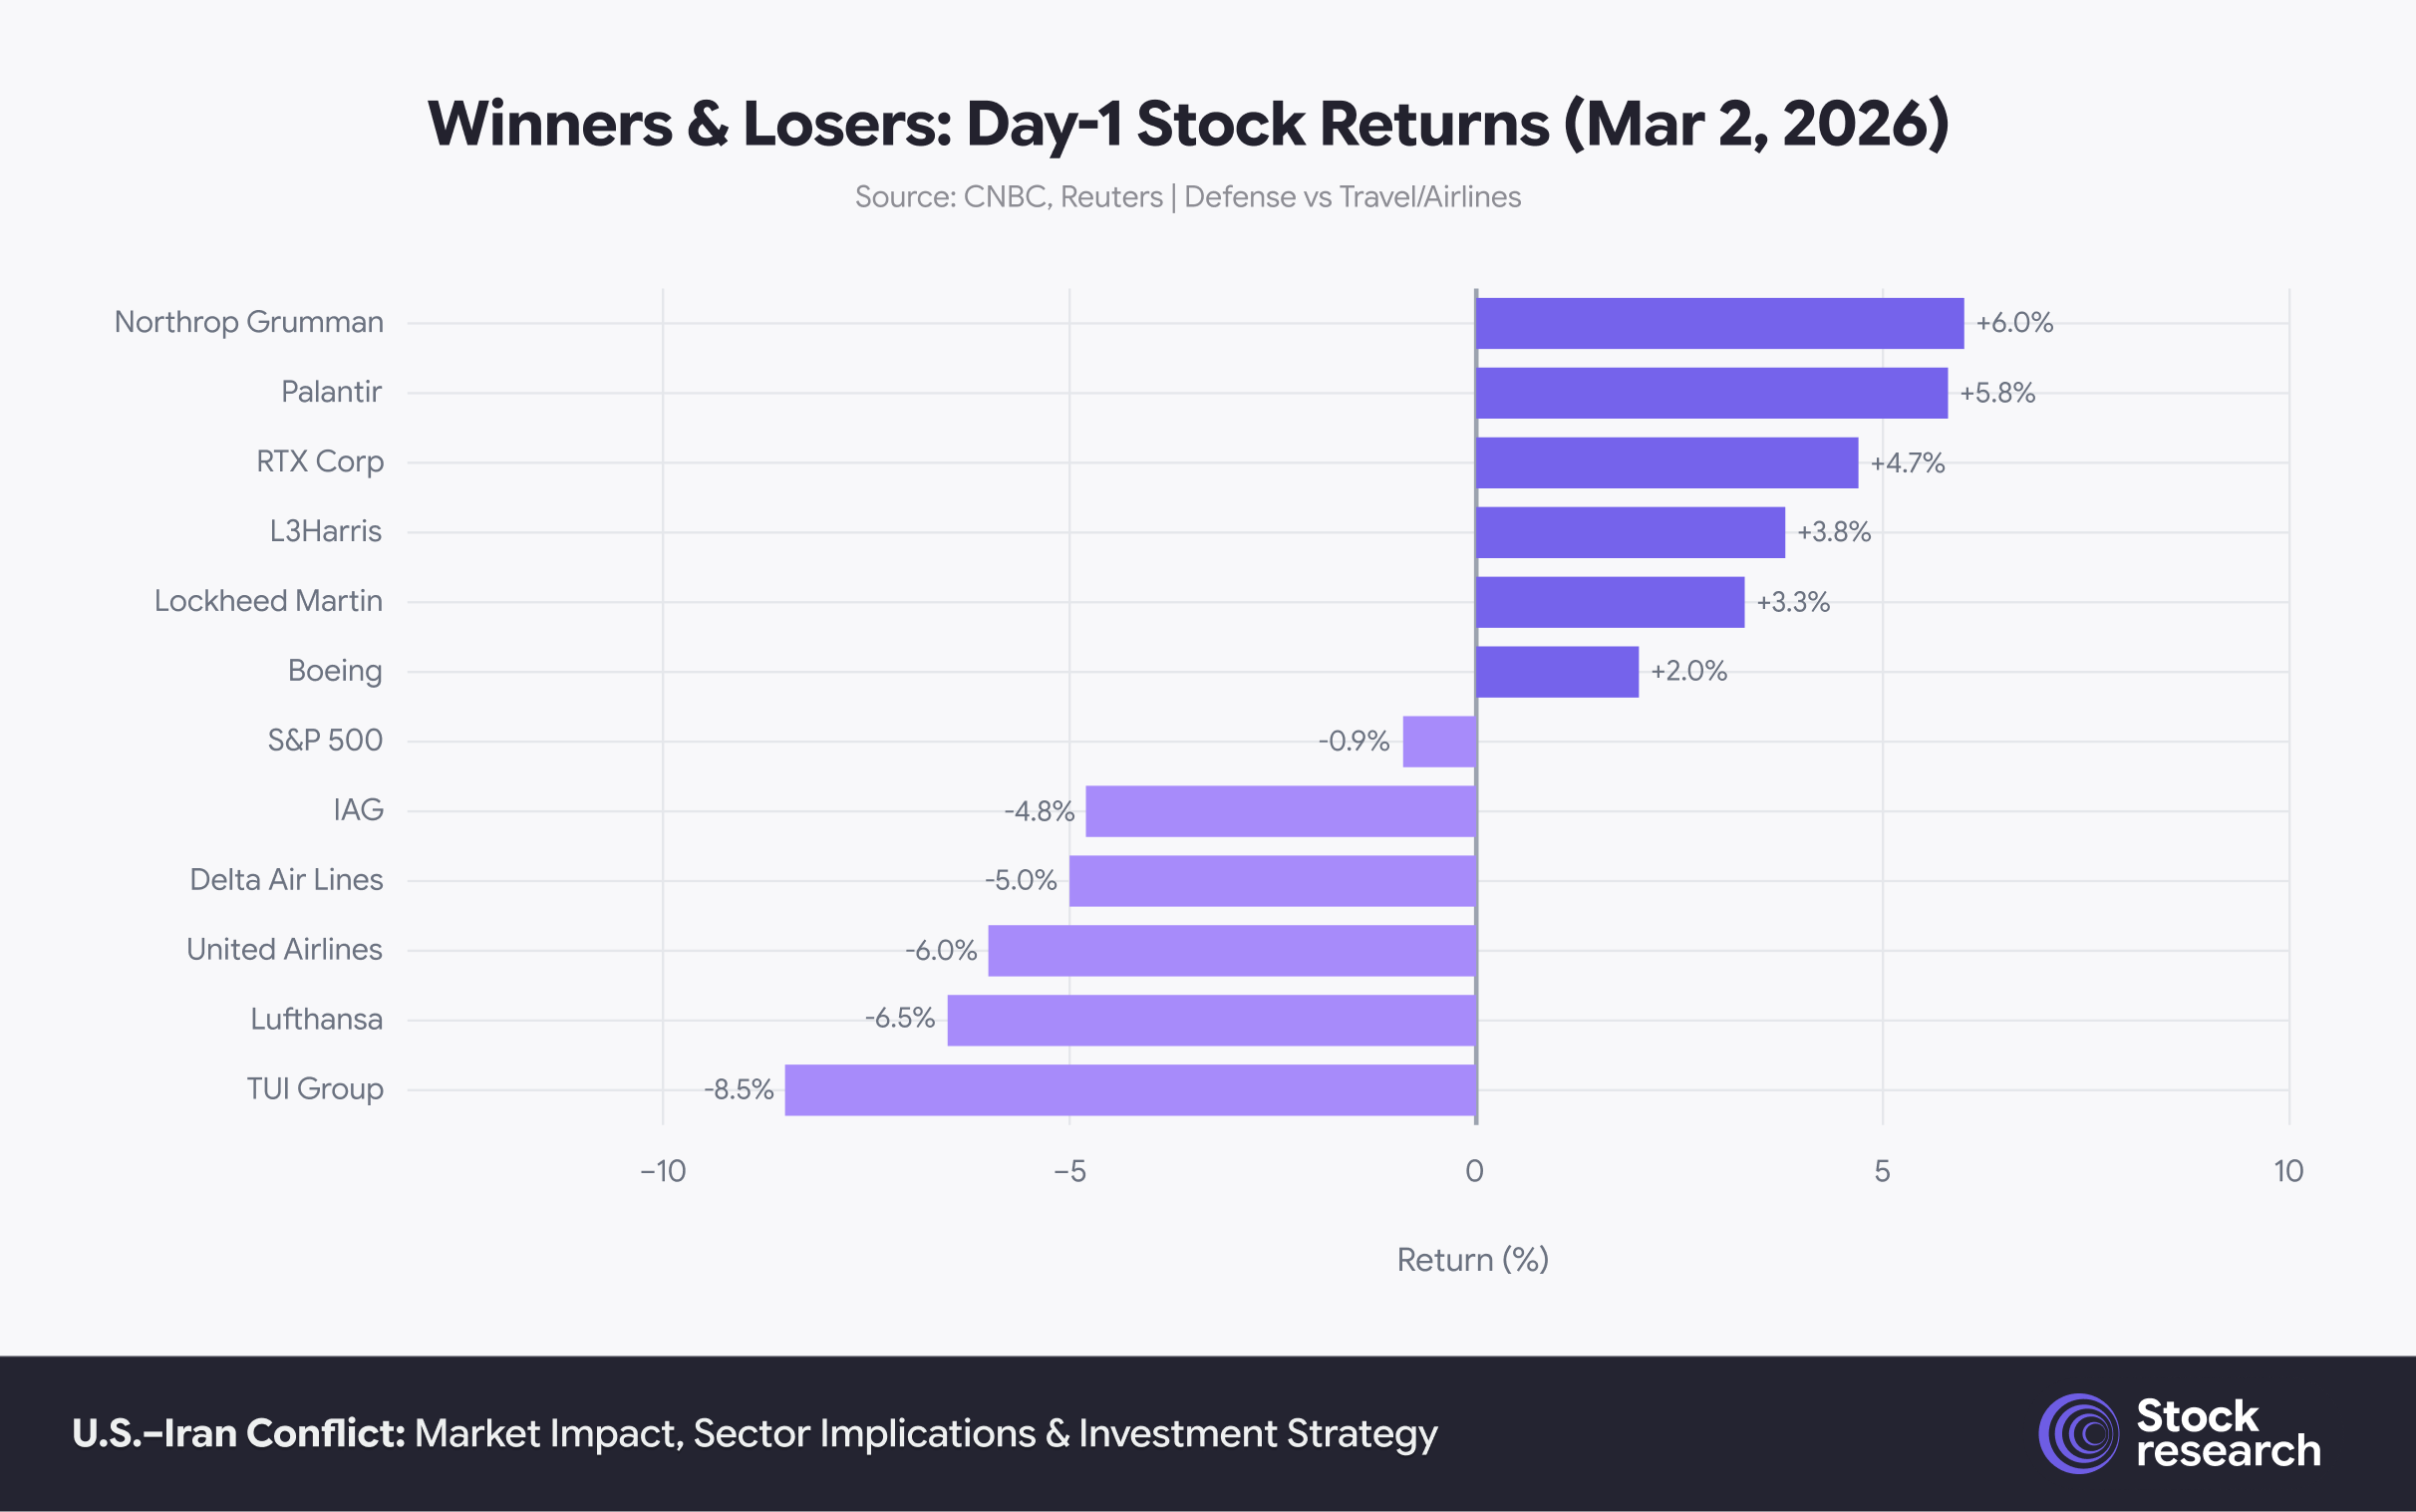
The +6% to -8.5% range between Northrop Grumman and TUI Group illustrates the binary nature of geopolitical shock positioning.
Defense: The Clearest Beneficiary
Defense contractors surged on both the immediate conflict spending implications and the longer-term expectation that U.S. and allied defense budgets will accelerate. Northrop Grumman led at +6%, followed by Palantir (+5.8%), RTX Corporation (+4.7%), L3Harris (+3.8%), Lockheed Martin (+3.3%), and Boeing (+2.0%). The iShares U.S. Aerospace & Defense ETF (ITA) is now up 14% year-to-date. This outperformance reflects a structural theme: Western defense spending was already accelerating post-Ukraine, and the Iran conflict provides another catalyst for multi-year budget increases across NATO and Gulf state allies.
Energy: Riding the Supply Premium
Energy equities have been the dominant sector in 2026. ExxonMobil has gained 32.5% over the past three months, and the iShares S&P Global Energy ETF is up 24% year-to-date. Unlike defense stocks, which benefit from anticipated spending, energy companies benefit from actual higher commodity prices flowing directly into earnings and cash flow. Every $10 increase in Brent crude translates to roughly $4–6 billion in additional annual free cash flow for the integrated majors.
Airlines and Travel: Maximum Pain
The damage to airlines and travel was swift. United Airlines fell 6%, Delta 5%, and American Airlines posted similar losses in U.S. trading. European carriers were hit even harder due to their greater Middle East route exposure, TUI Group dropped 8.5%, Lufthansa 6.5%, and IAG (British Airways parent) 4.8%. Thousands of flights were rerouted or cancelled as Middle East airspace closures expanded, adding hours and fuel costs to routes between Europe and Asia. Beyond the immediate operational disruption, airlines face the double headwind of higher jet fuel costs (kerosene tracks Brent crude with roughly a 6-week lag) and potential demand destruction if consumers pull back on discretionary travel.
The Strait of Hormuz: Why This Crisis Is Different
The Strait of Hormuz is a 21-mile-wide chokepoint between Iran and Oman through which approximately 20% of the world’s seaborne crude oil, roughly 15–16 million barrels per day, transits daily. It also handles roughly 20% of global LNG trade and 33% of global urea (fertilizer) trade.
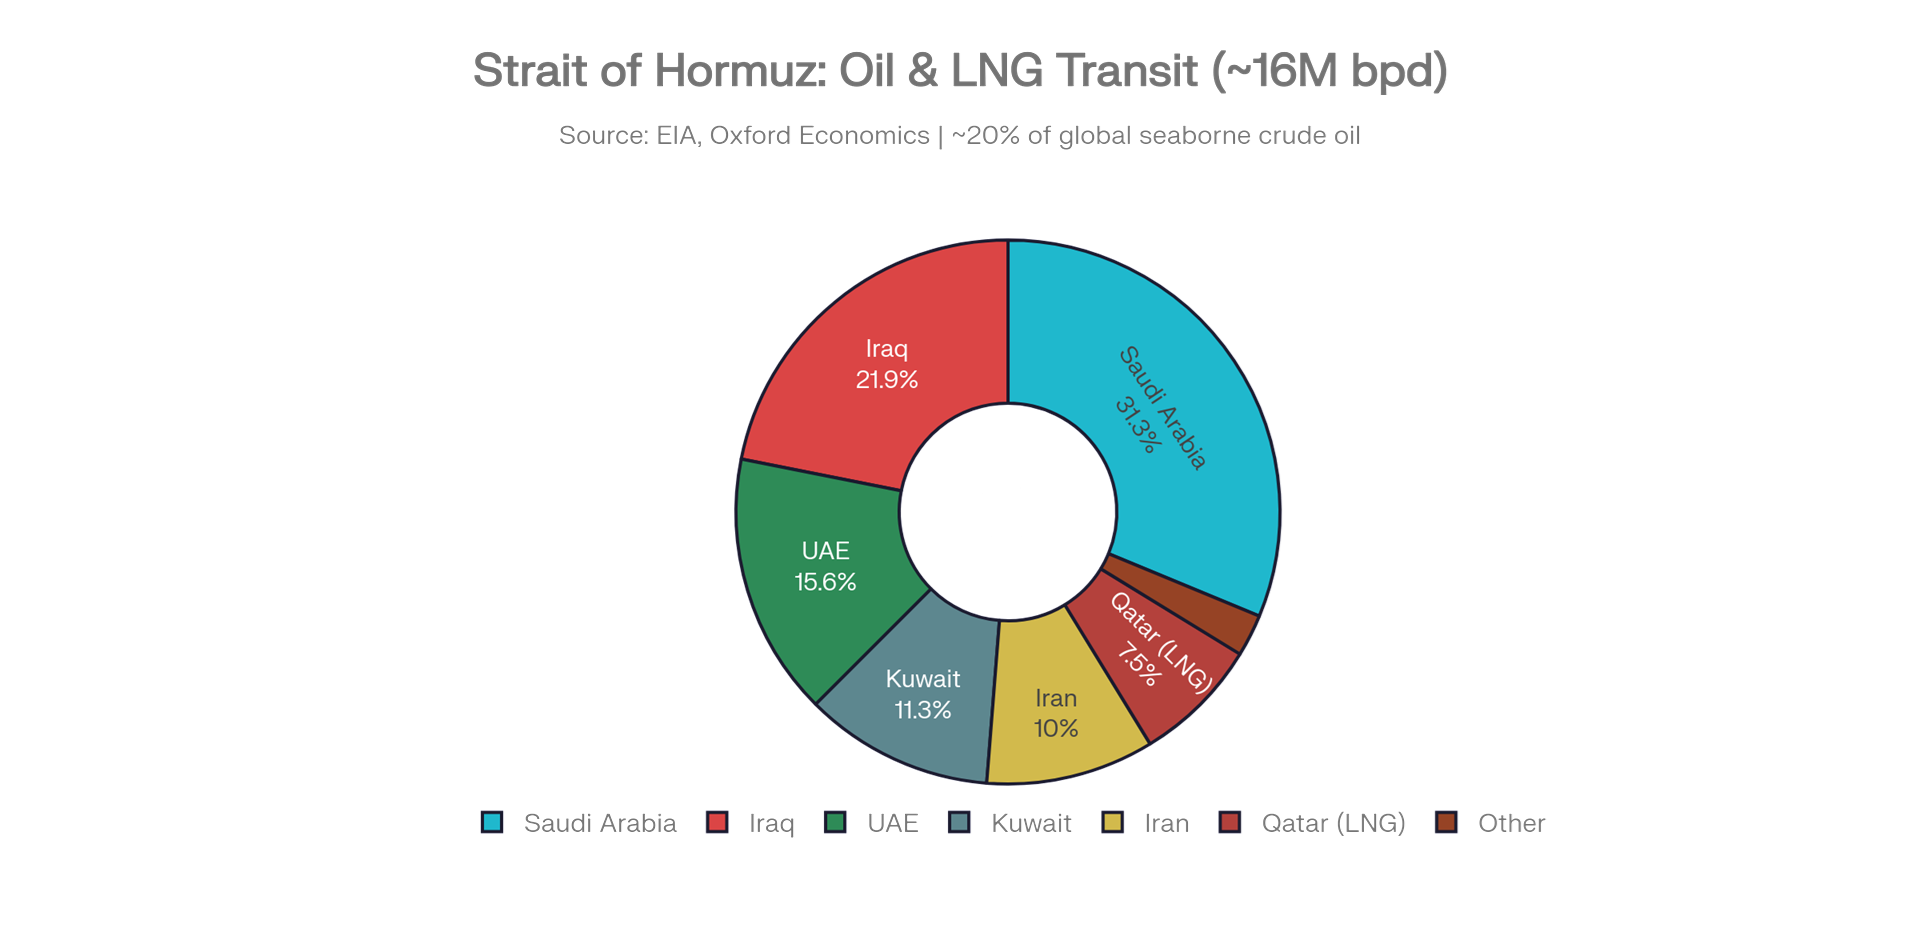
Saudi Arabia alone accounts for nearly one-third of all transit through the strait, making any disruption an existential threat to global energy supply chains.
Iran has threatened to close the strait many times before, during the Iran-Iraq War, during the 2019 tanker seizures, and during the June 2025 conflict, but never followed through in a sustained manner. This time is different because Iran is responding to existential-level attacks on its military infrastructure and leadership. The IRGC Navy has deployed fast-attack boats, mines, and anti-ship cruise missiles in the strait, and Lloyd’s of London raised war-risk insurance premiums to levels not seen since the Tanker War of 1987–88.
Scenario Analysis: Three Paths Forward
The outcome of this conflict will determine whether the current oil spike is a temporary dislocation or the beginning of a sustained energy crisis. Below are three scenarios with estimated market impacts based on available data from Goldman Sachs, Oxford Economics, and historical precedent.
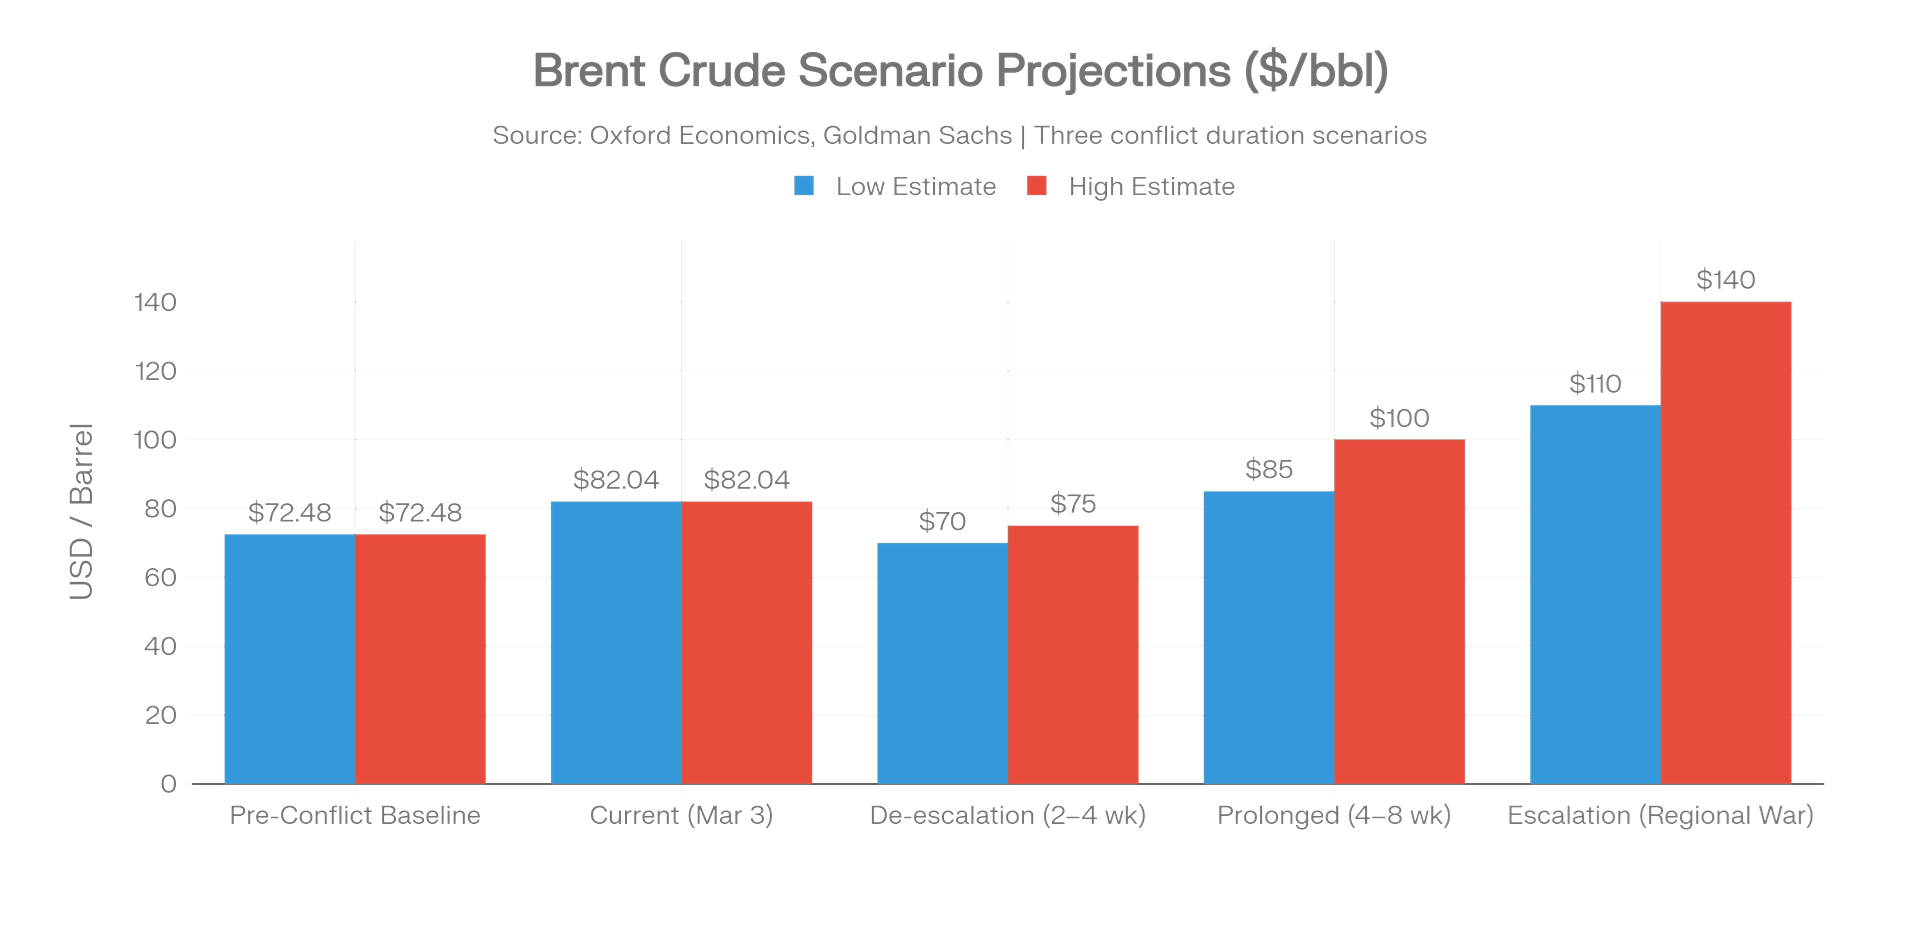
The gap between de-escalation ($70–75) and major escalation ($110–140) represents a potential 100% variance in energy costs, the widest scenario spread since the 2022 Russia-Ukraine conflict.
-
Scenario 1, De-escalation (35% probability). Diplomatic channels produce a ceasefire within 2–4 weeks. Hormuz reopens to commercial traffic. Brent retraces to $70–75 as the risk premium evaporates. Equities recover, and the Fed resumes its easing cycle. This is the market’s best-case outcome but requires Iran’s post-Khamenei leadership to seek de-escalation despite enormous domestic pressure for retaliation.
-
Scenario 2, Prolonged tensions (45% probability). The conflict continues for 4–8 weeks with sporadic attacks, partial Hormuz disruption, and elevated insurance premiums. Brent settles in the $85–100 range. The S&P 500 experiences a 5–10% correction as inflation expectations rise and Fed rate cuts are fully priced out. This is the base case, uncomfortable but manageable.
-
Scenario 3, Major escalation (20% probability). The conflict expands to include direct attacks on Saudi or UAE oil infrastructure, a full Hormuz blockade, or broader regional war involving Hezbollah. Brent spikes to $110–140. The S&P 500 enters correction territory (-15% to -25%). Inflation surges above 4%. The Fed is forced to pause all cuts, and recession risk rises sharply. This is the tail-risk scenario that institutional investors are hedging against.
Investment Opportunities: Positioning Your Portfolio
Based on the analysis above, the following opportunities emerge across the risk spectrum.
-
Energy equities remain the most direct beneficiary. Integrated majors (XOM, CVX) offer the best risk-adjusted exposure because they benefit from higher oil prices while maintaining downstream margins that buffer against price reversals. E&P names (PXD, EOG) offer higher beta to oil prices but carry more downside risk in a de-escalation scenario.
-
Defense contractors benefit from both the immediate conflict and the structural trend of rising Western defense budgets. Lockheed Martin (LMT), Northrop Grumman (NOC), and RTX offer the most direct exposure to U.S. military procurement, while Palantir (PLTR) benefits from intelligence and surveillance demand.
-
Gold and gold miners serve as the purest geopolitical hedge. Gold’s move above $5,200 suggests the metal has entered a new structural regime driven by central bank buying, de-dollarization, and geopolitical risk. Miners (NEM, GOLD) offer leveraged exposure to the metal’s price.
Inflation hedges including TIPS, commodity ETFs (DJP), and real asset-heavy REITs provide portfolio-level protection against the stagflation scenario that markets are beginning to price.
What to underweight. Airlines (UAL, DAL, AAL), European travel operators (TUI), consumer discretionary names reliant on low energy costs, and long-duration bonds all face headwinds that could persist for weeks or months.
StockResearch AI Watchlist
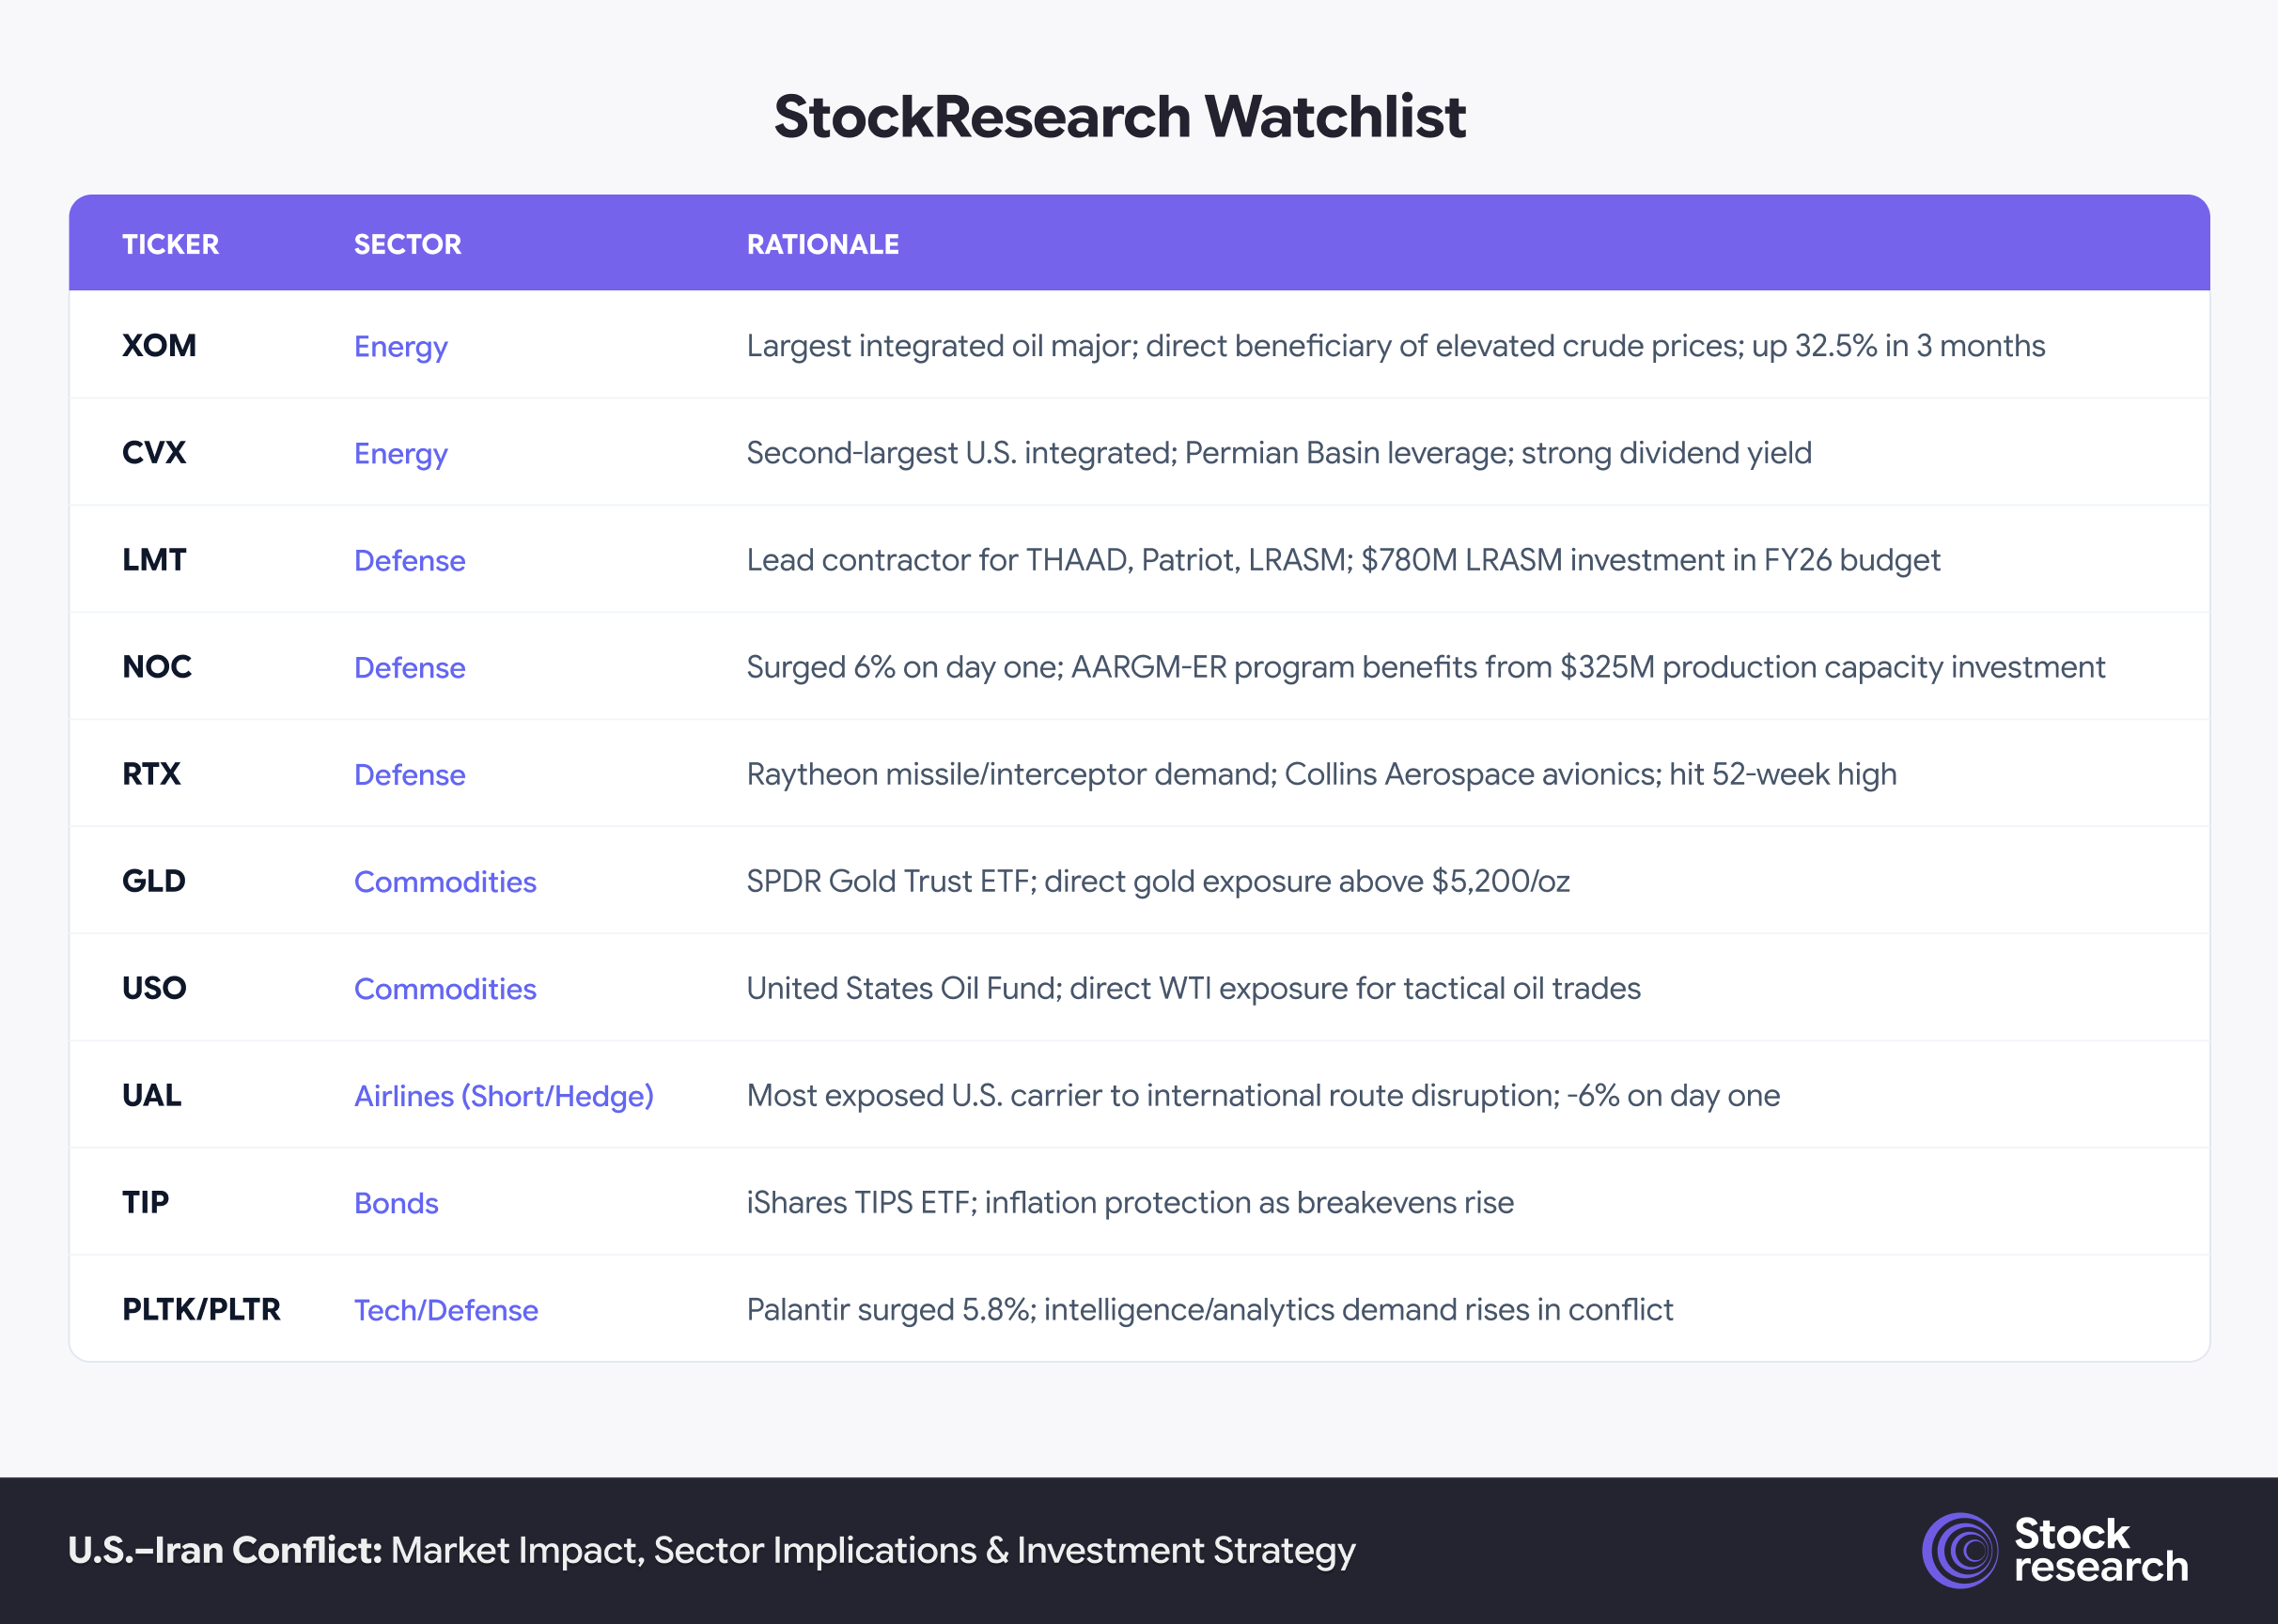
StockResearch AI Watchlist: Key Tickers to Monitor During the Iran Conflict.
Risks & What Could Invalidate This Thesis
Several factors could alter the base case dramatically.
-
Diplomatic resolution. If Iran’s post-Khamenei leadership opts for negotiation rather than escalation, the risk premium could evaporate within days. Brent could retrace below $72, and the sectors discussed above would reverse sharply, energy and defense falling, airlines and travel recovering.
-
Strategic Petroleum Reserve release. The U.S., Europe, Japan, and South Korea collectively hold approximately 1.5 billion barrels in strategic reserves. A coordinated release, as occurred in 2022 post-Ukraine, could temporarily cap oil price upside, though it cannot address a sustained Hormuz closure.
-
OPEC over-compliance. If Saudi Arabia and the UAE fully deploy their 2.5 million bpd of spare capacity, it would partially offset the supply disruption, though not fully replace Hormuz transit volumes.
-
Demand destruction. If oil prices remain above $100 for an extended period, demand destruction (consumers driving less, manufacturers cutting production) could naturally moderate price pressures, as occurred in the second half of 2022.
What to Watch in the Coming Weeks
The next 2–4 weeks will determine which scenario plays out. The key indicators to monitor, in order of importance:
-
Strait of Hormuz tanker traffic. Real-time AIS shipping data will show whether commercial vessels are resuming transit. This is the single most important variable for oil prices.
-
Iran’s post-Khamenei leadership transition. Who assumes control, a pragmatic faction or hardliners, will shape Iran’s escalation calculus.
-
OPEC emergency meetings. Any announcement of accelerated production increases would signal that Saudi Arabia views the disruption as sustained.
-
Fed communications. Watch for any shift in language from “monitoring” to “concerned” regarding inflation. The March 18–19 FOMC meeting will be the first official policy response.
-
5-year breakeven inflation rate. Already at 2.503%, a move above 2.6% would signal that bond markets are pricing in a structural inflation regime shift.
-
VIX term structure. If the VIX futures curve shifts from contango (normal) to backwardation (crisis), it would indicate that institutional investors expect volatility to persist rather than fade.
This report is for informational purposes only and does not constitute investment advice. All investments carry risk, including the potential loss of principal. Past performance of any asset class, sector, or security does not guarantee future results. The scenarios, projections, and price targets discussed are based on publicly available data and analyst estimates as of March 6, 2026, and are subject to change. Readers should conduct their own due diligence and consult a qualified financial advisor before making investment decisions.