
Energy Supercycle 2.0: Oil, War & the Next Commodity Bull Run
Let’s start with a number: $37.2 billion.
That’s how much ExxonMobil returned to shareholders in 2025 alone, dividends plus buybacks. Not revenue. Not operating cash flow. Returned directly to investors. In a single year.
Now let us give you another number: 9.3x.
That’s the forward P/E the entire energy sector trades at today. Less than half the S&P 500’s 20.6x multiple.
A sector generating historic levels of free cash flow, sitting on some of the strongest balance sheets in corporate America, operating in a world where oil has become a geopolitical weapon, and the market is pricing it like a dying industry.
That disconnect is the entire thesis.
What Is Actually Happening Right Now
The Strait of Hormuz, a 21-mile chokepoint between Iran and Oman, carries approximately 13 million barrels of crude oil per day. That’s roughly 31% of all maritime oil transport on the planet. Every barrel heading from the Persian Gulf to Asia, Europe, and beyond passes through it.
It is now under active disruption.
Following U.S.-Israeli military action against Iranian nuclear facilities in early 2026, traffic through the strait collapsed. Brent crude surged to $110 before settling near $91–$100. BlackRock CEO Larry Fink went on record: “If oil reaches $150, we’re looking at a global recession.” Oxford Economics put the math on it, $140/bbl sustained for two months tips the global economy into contraction.
We are not at $150. But we are in a world where $150 is a scenario being modeled by the largest asset managers on earth.
And here’s the thing most investors miss: the Hormuz disruption is not the thesis. It’s the accelerant.
The real story started years before this conflict. And it’s structural.
The Setup That Was Already in Place
Cast your mind back to 2020–2022. ESG pressure was at its peak. Major oil companies were slashing exploration budgets under shareholder pressure to “transition.” Banks were pulling financing from new fossil fuel projects. The narrative was clear: oil demand peaks by 2025, the energy transition accelerates, hydrocarbons become stranded assets.
That narrative drove a collapse in upstream capital expenditure, from ~$600 billion annually in 2015 down to $300 billion at the 2020 pandemic nadir.
It turns out the narrative was wrong. Or at least, premature.
Global oil demand didn’t peak. It grew. EVs are displacing roughly 1.7 mb/d of oil consumption in 2025, real and meaningful, but aviation, shipping, petrochemicals, and emerging market mobility absorbed that and more. The IEA now projects India’s oil demand growing by 1 mb/d through 2030. Aviation fuel consumption is rising at 4.5% annually. Petrochemicals have no electrification pathway.
Demand stayed. Supply didn’t keep up.
The International Energy Forum calculates that $4.3 trillion in upstream investment is needed between 2025–2030 to meet projected demand. The industry is spending roughly $420 billion annually, less than half that pace. The gap is not closing. It is widening.
OPEC+ Changed the Game
In previous oil cycles, OPEC was the cartel that always cheated. Member nations would agree to cuts and then quietly pump more to grab market share. The discipline never lasted. Supply flooded back. Prices crashed.
That pattern is broken.
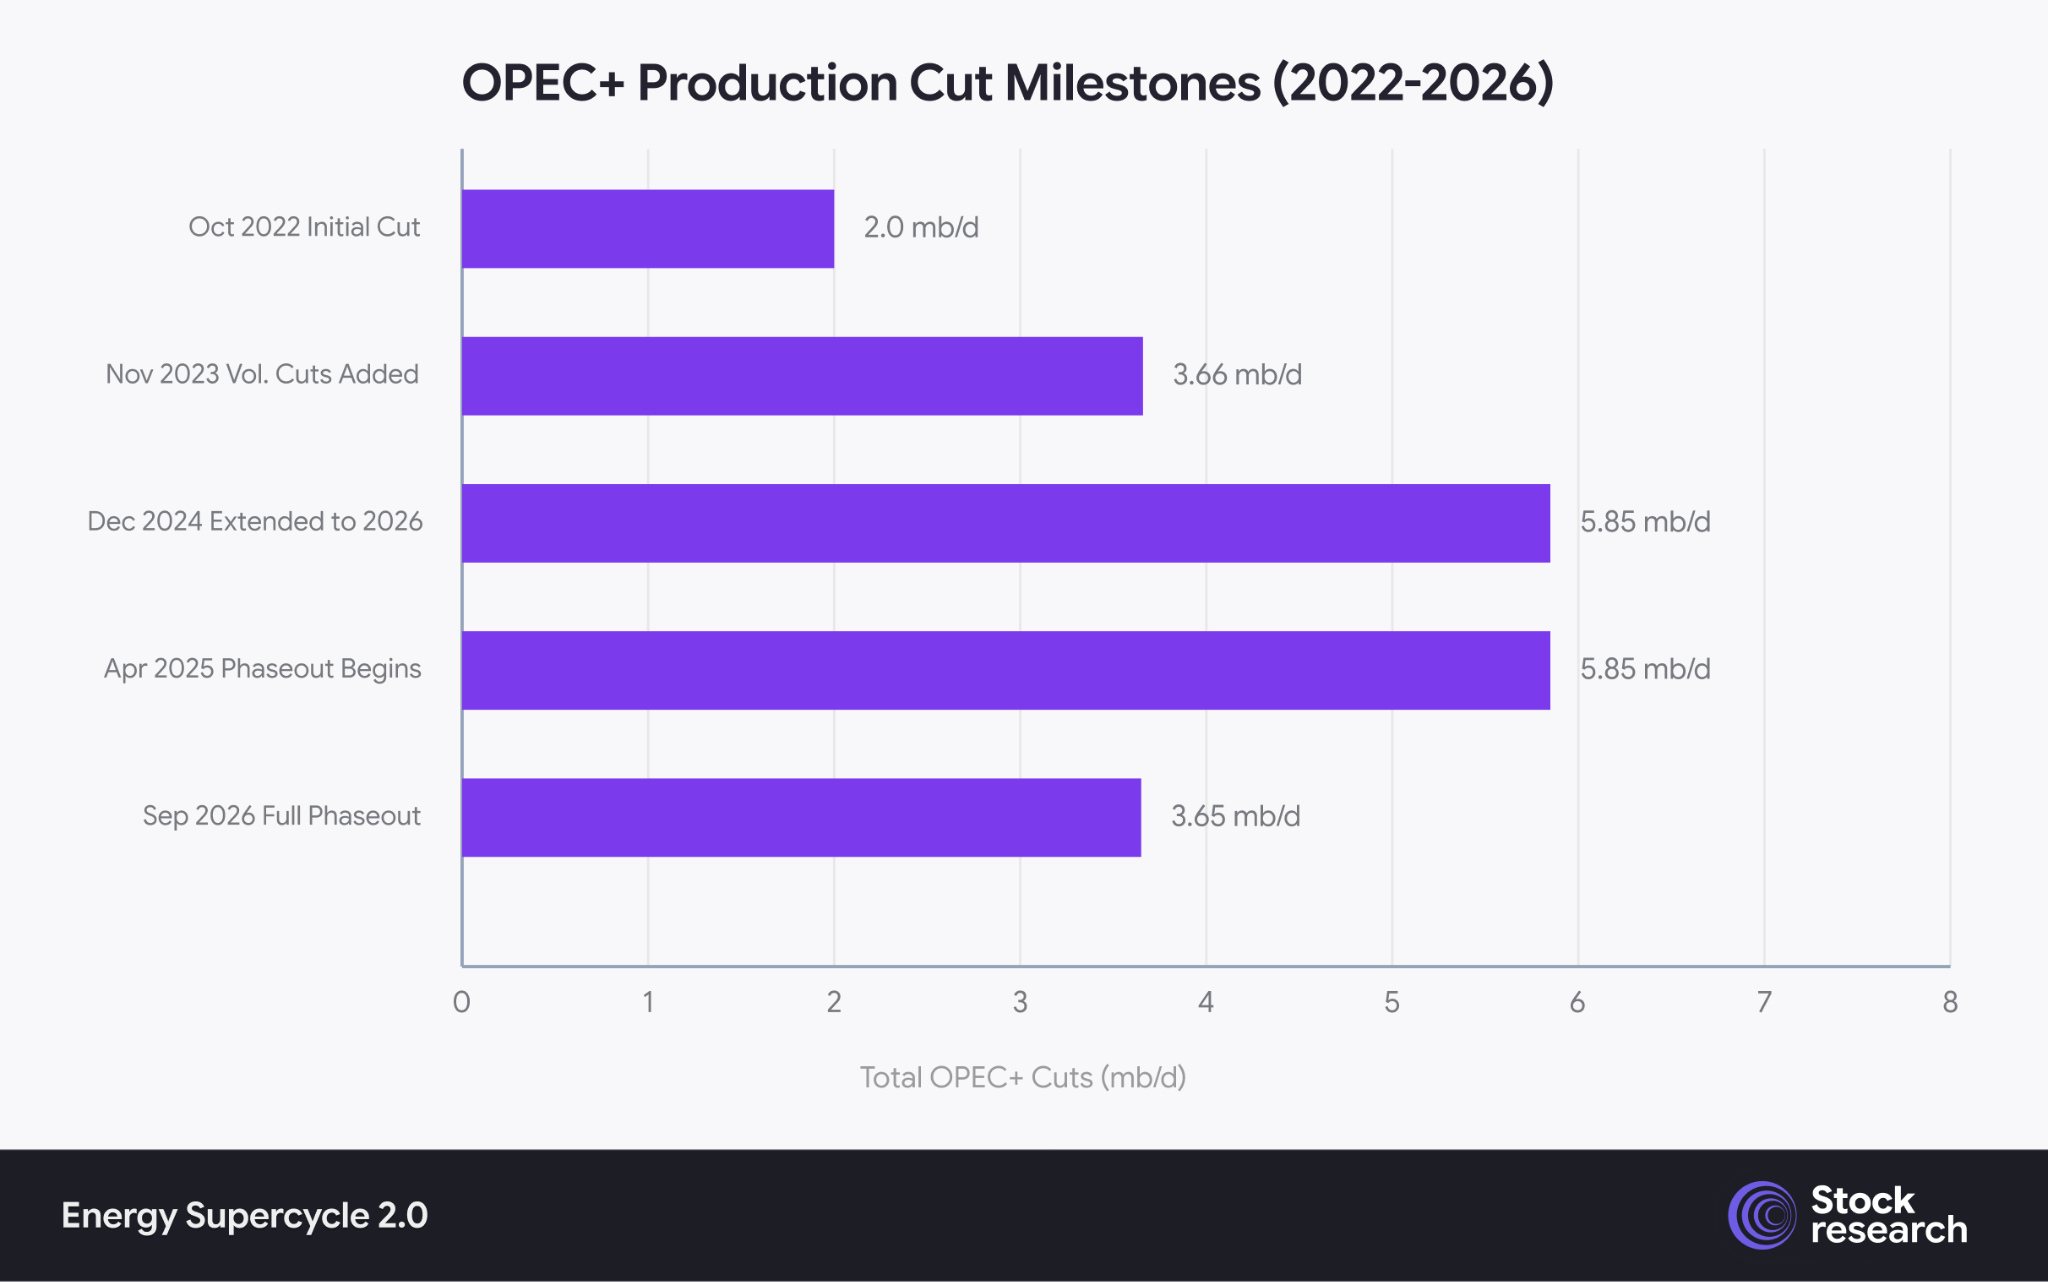
OPEC+ accumulated production cuts rose from 2.0 mb/d (Oct 2022) to a peak of 5.85 mb/d (Dec 2024), with a gradual phaseout scheduled through September 2026. Repeated extensions signal durable supply discipline.
Since October 2022, OPEC+ has progressively deepened its cuts, reached a peak of 5.85 mb/d, roughly 5.7% of global oil demand, and then repeatedly postponed its unwind timeline every time market conditions softened. The eight core nations (Saudi Arabia, Russia, Iraq, UAE, Kuwait, Kazakhstan, Algeria, Oman) have demonstrated a level of coordination that would have been unthinkable in the 2014–2016 era.
J.P. Morgan estimates that OPEC’s diminishing spare capacity now introduces a structural $20–$30/bbl risk premium into oil prices, a floor that simply didn’t exist in previous cycles.
The Permian Is Telling You Something
The United States shale revolution was the most disruptive force in energy markets in the last 50 years. From 2010 to 2024, U.S. tight oil accounted for 90% of global supply growth. Any time oil prices rose above $60, American producers flooded the market with new barrels within 12–18 months. It was the ultimate supply safety valve.
That valve is closing.
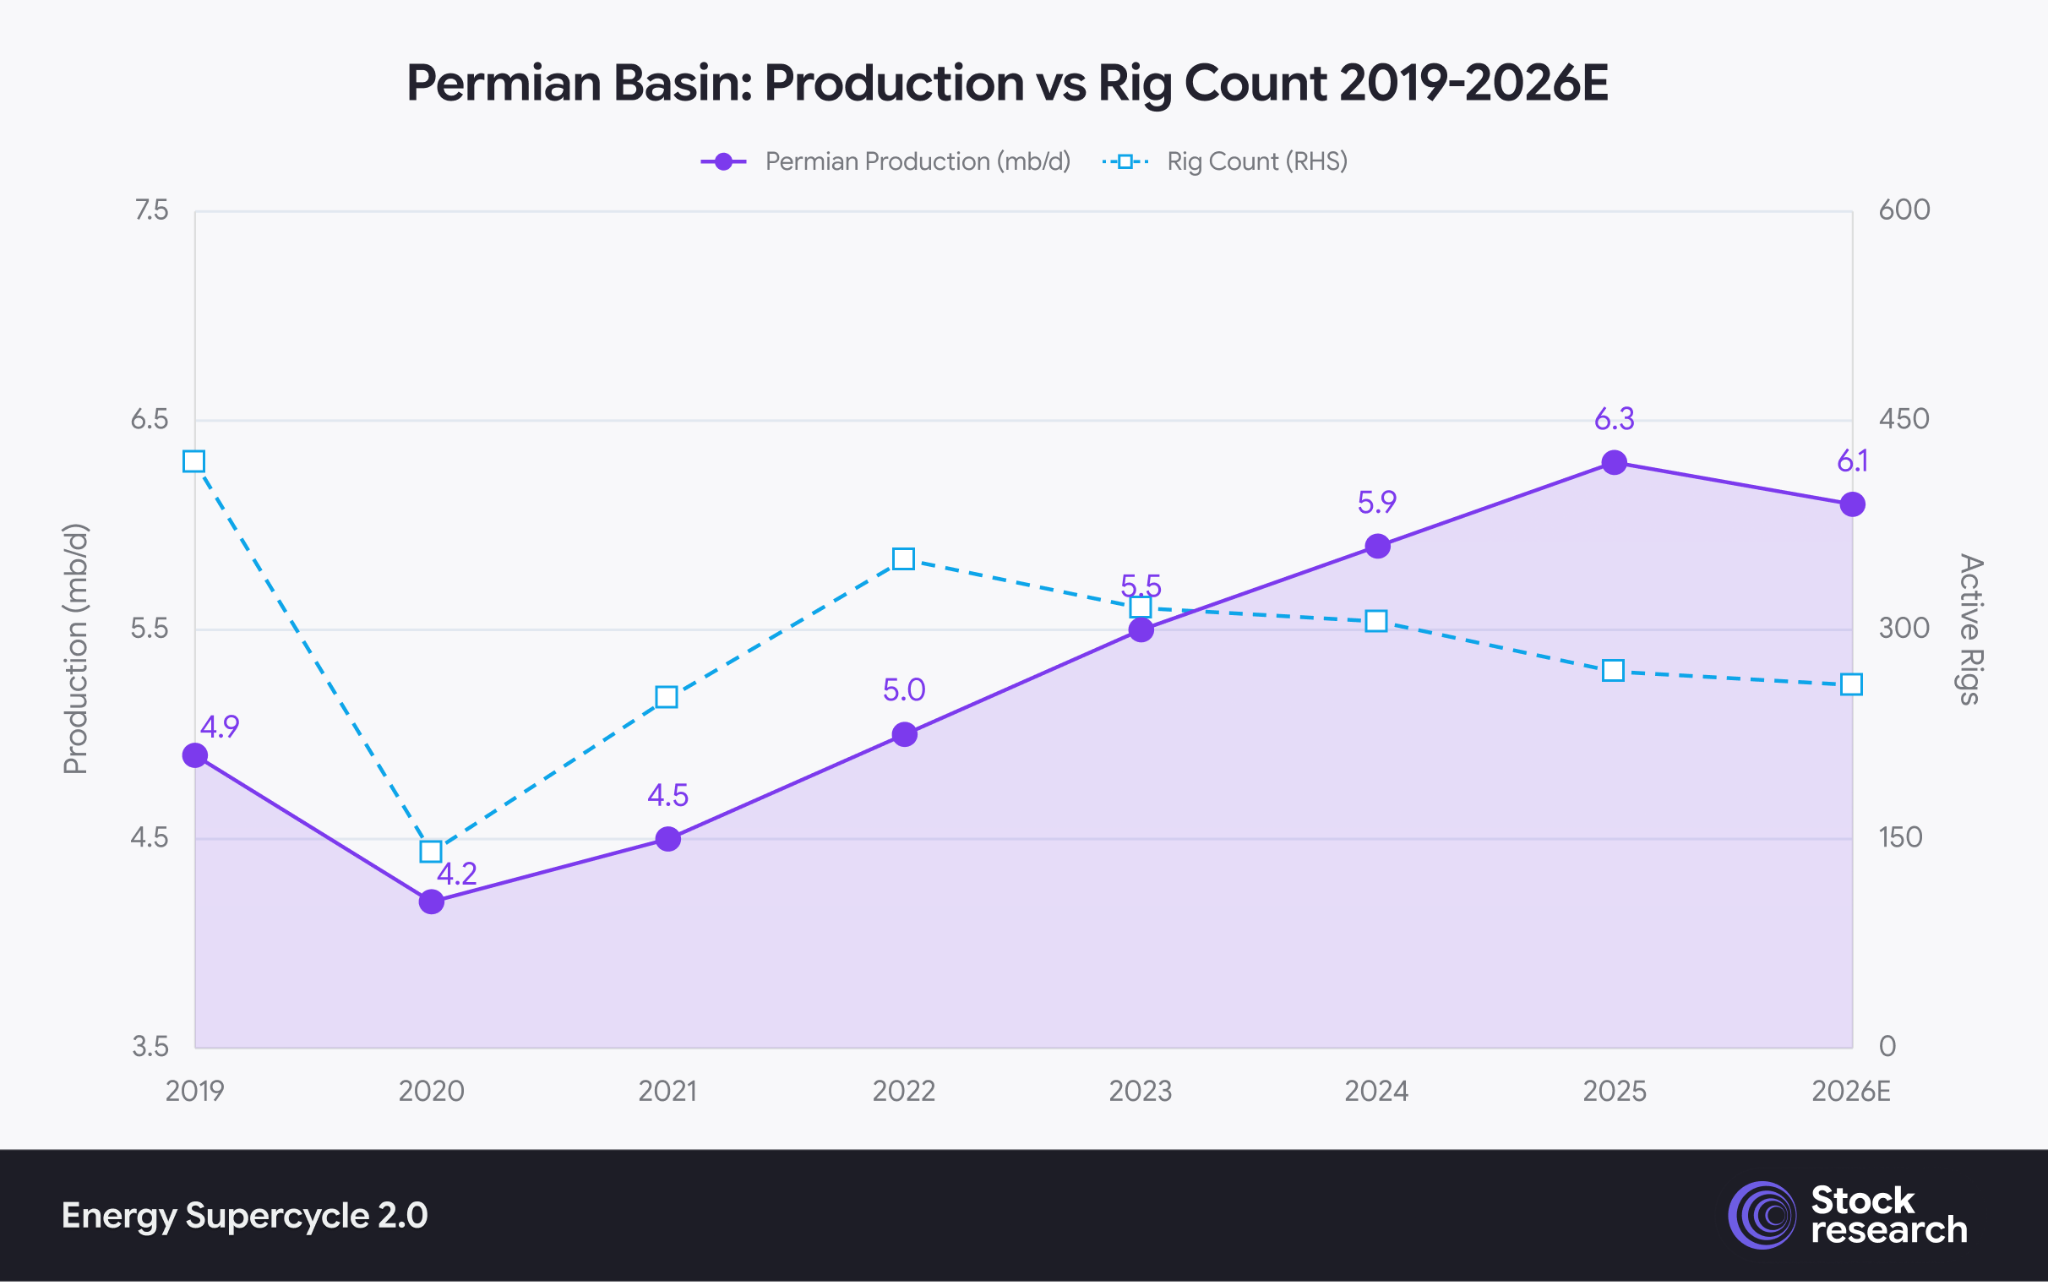
Permian Basin oil production climbed steadily to a peak of 6.3 mb/d (2025), while active rig count fell from ~420 in 2019 to ~260 by 2026E, a divergence signaling efficiency gains are masking underlying depletion.
The Permian Basin, engine of American shale, hit peak output at approximately 6.3 mb/d in December 2025. Active rigs are down 15% year-over-year. Secondary drilling zones in the basin carry 15–20% lower reserves than the Tier 1 inventory that’s already been largely drilled. The EIA projects U.S. crude production falling to 13.3 mb/d by Q4 2026.
More importantly: companies aren’t trying to grow production anymore. Capital discipline has replaced growth-at-all-cost. The major shale producers maintain breakeven costs around $30–$50/bbl and prioritize buybacks over drilling. ConocoPhillips. Devon. EOG. All of them are returning cash, not chasing barrels.
This is a structural shift. Not a temporary pause.
This Is Not Your Father’s Oil Cycle
Every oil cycle in history followed the same arc: scarcity → high prices → massive investment → oversupply → price crash. The self-correcting mechanism always worked, eventually.
The mechanism is broken at every node this time.
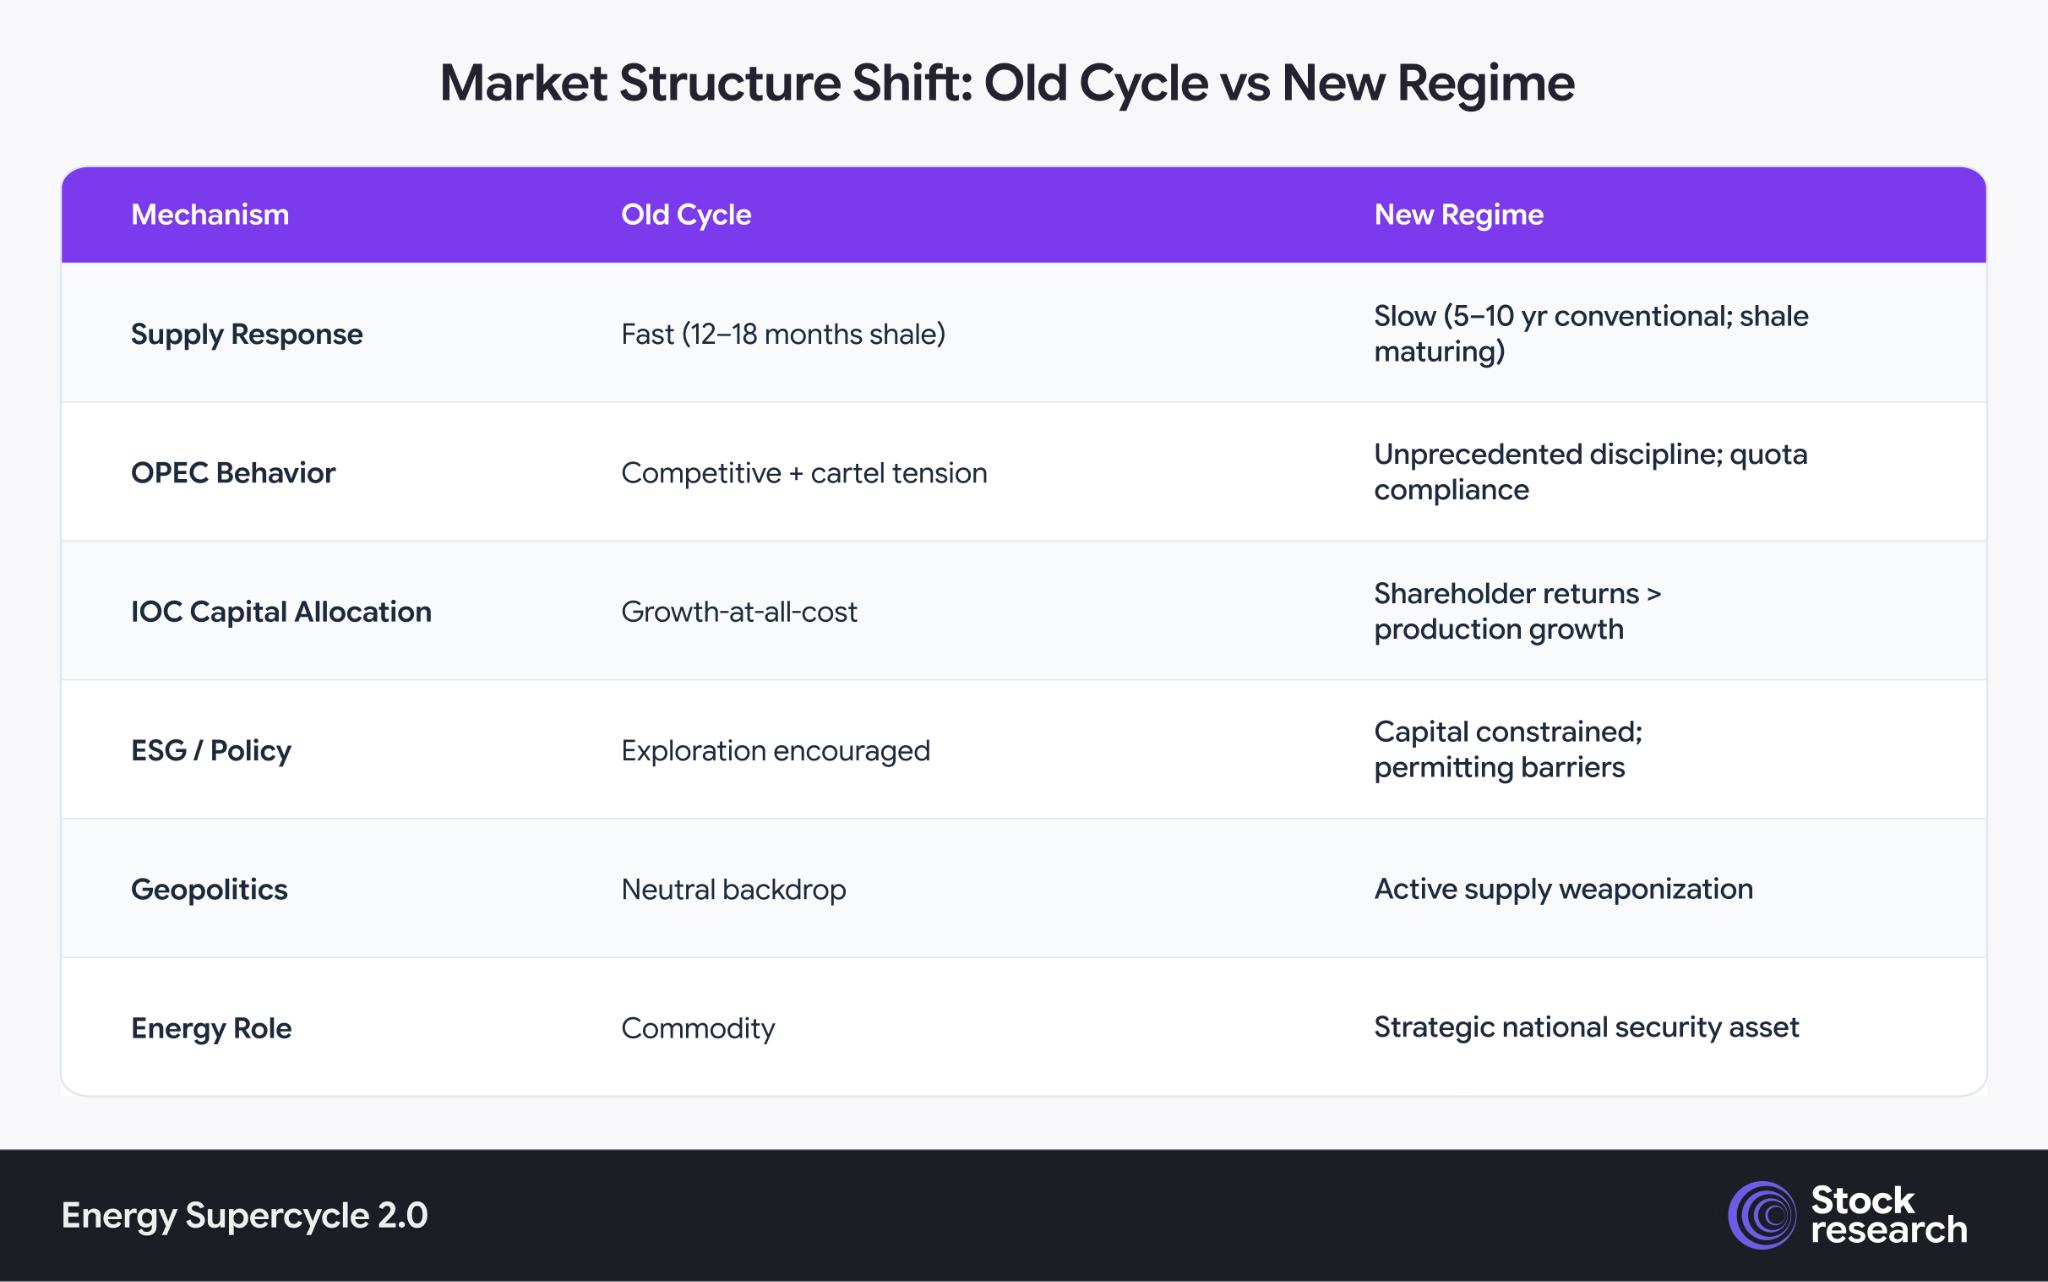
The structural break between the old oil cycle and the new energy regime across six key market mechanisms. Unlike previous cycles where supply responded elastically within 12–18 months, the new regime is defined by slow supply response, OPEC+ discipline, capital-return-focused IOCs, and energy’s elevation to a strategic national security asset.
Supply response is now measured in years, not months. IOCs are choosing buybacks over exploration. OPEC is managing price, not market share. And most importantly, energy has become an instrument of statecraft.
Europe learned this the hard way in 2022. The forced decoupling from Russian gas permanently restructured LNG trade flows, accelerated infrastructure investment, and put energy security at the top of every government’s policy agenda. Nations are now building strategic reserves, diversifying supply chains, and subsidizing domestic production regardless of short-term economics.
Janus Henderson’s portfolio managers, writing in March 2026, called it “Supercycle 2.0”, driven by deglobalization, decarbonization, demographics, and AI power demand, and noted the cycle “remains in its early stages.”
Previous commodity supercycles lasted 10–25 years. We’re roughly 3–4 years in.
The Number That Should Stop You Cold
Here is the most important chart in this entire report:
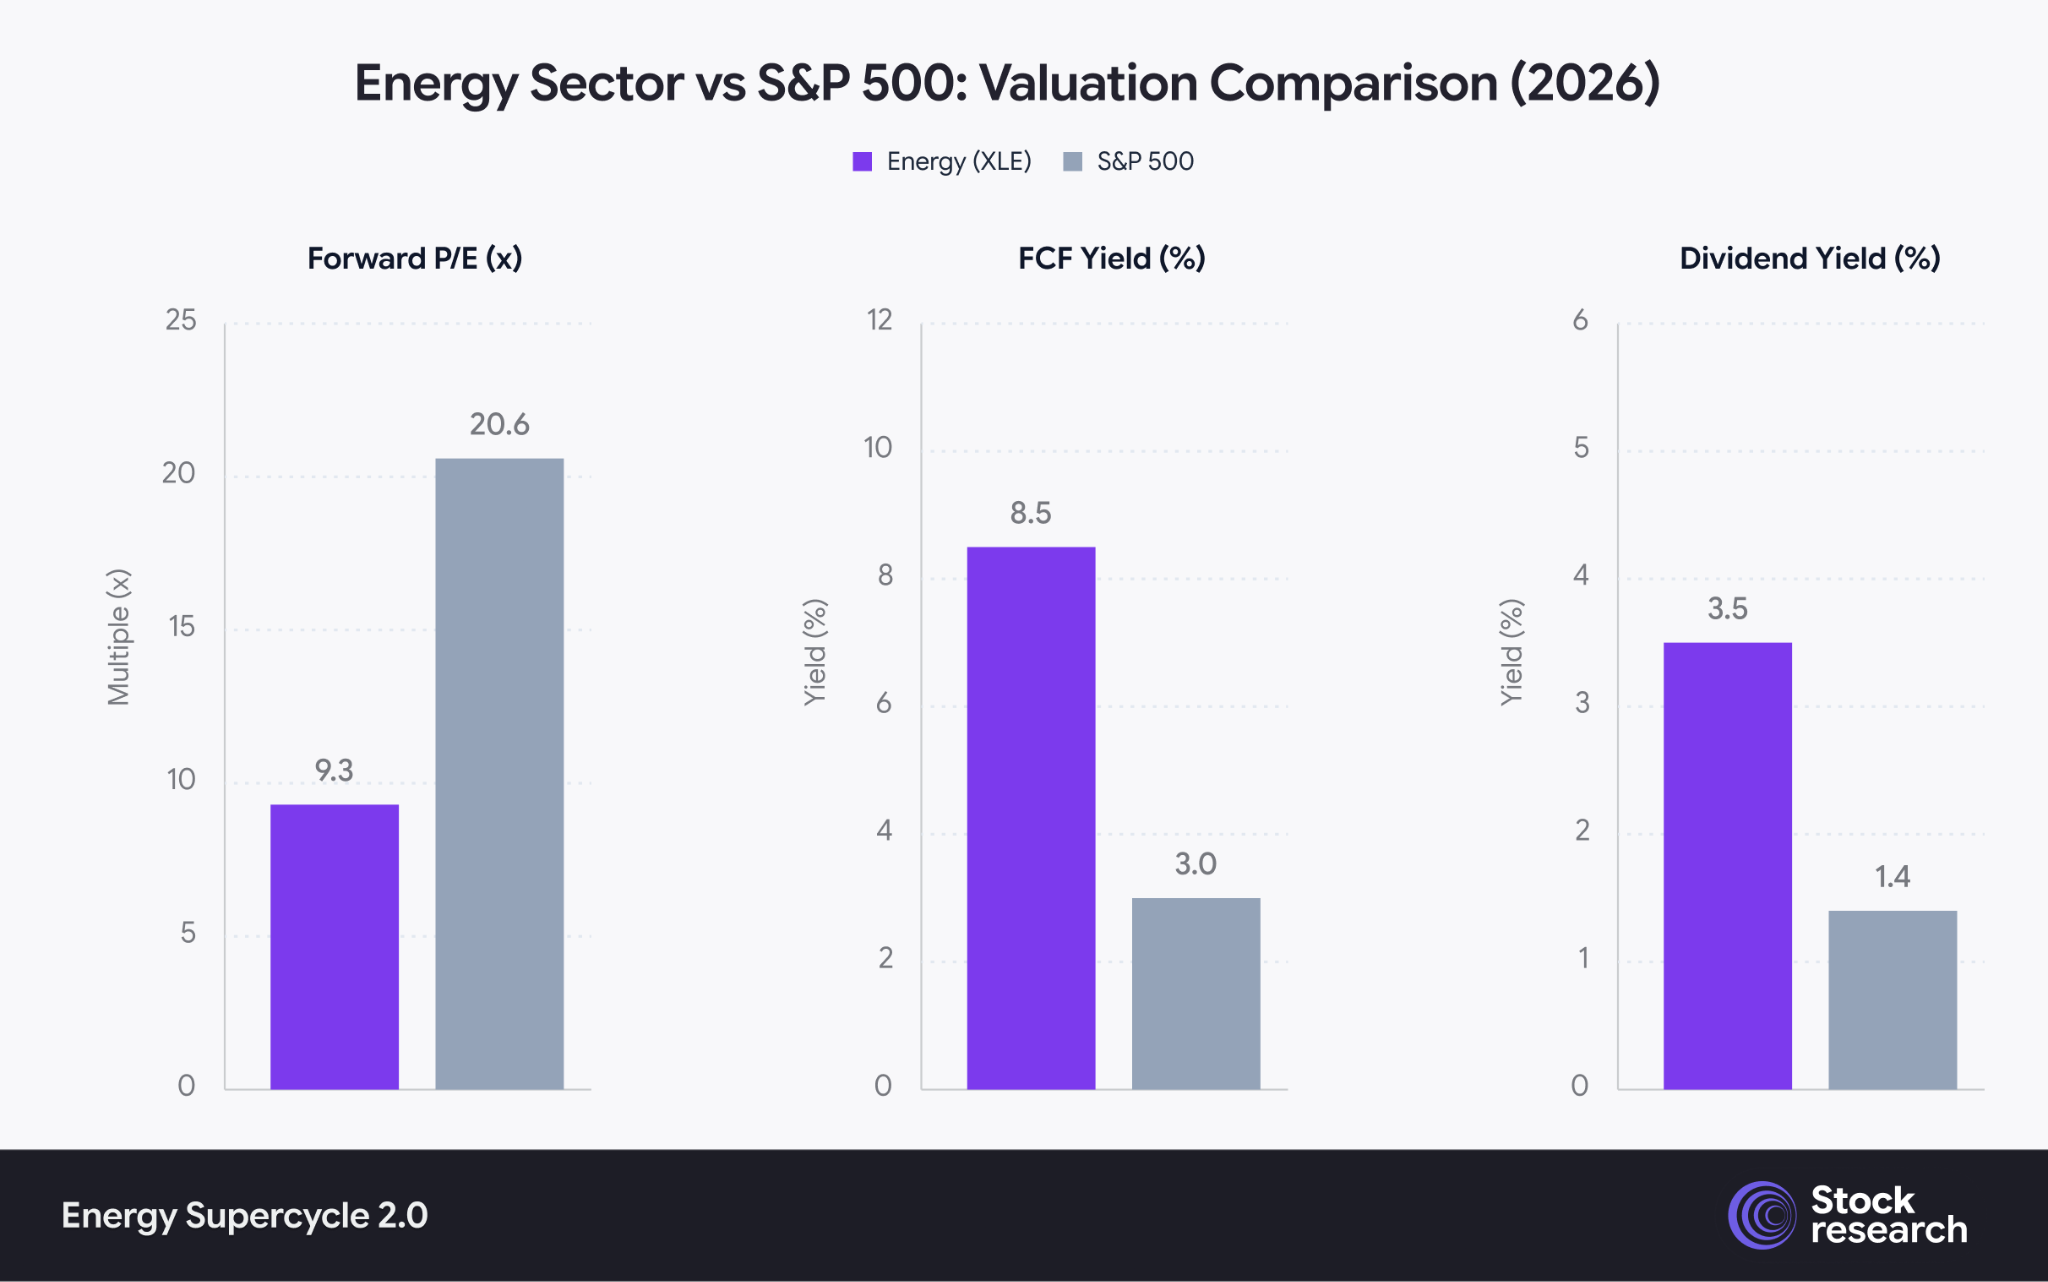
The energy sector (XLE) trades at a deep discount to the S&P 500: Forward P/E of 9.3x vs. 20.6x, FCF Yield of 8.5% vs. 3.0%, and Dividend Yield of 3.5% vs. 1.4%. Energy offers more than twice the cash generation and income at less than half the earnings multiple.
Let that sink in.
The energy sector generates 2.8x more free cash flow per dollar of market cap than the average S&P 500 company. It pays 2.5x the dividend yield. And it trades at less than half the earnings multiple.
The entire energy sector represents 3.5% of the S&P 500. Nvidia alone is 6.9%. A single semiconductor company is worth more than every publicly listed U.S. oil and gas company combined.
Bank of America’s strategists noted in March 2026 that the S&P 500 appears more expensive relative to crude oil than at any time since the 1960s, except during COVID and the Tech Bubble. Two of the most extreme valuation anomalies in modern market history.
Institutional reallocation into energy hasn’t happened yet. Most portfolio managers are still underweight. That’s your window.
What Are the Scenarios?
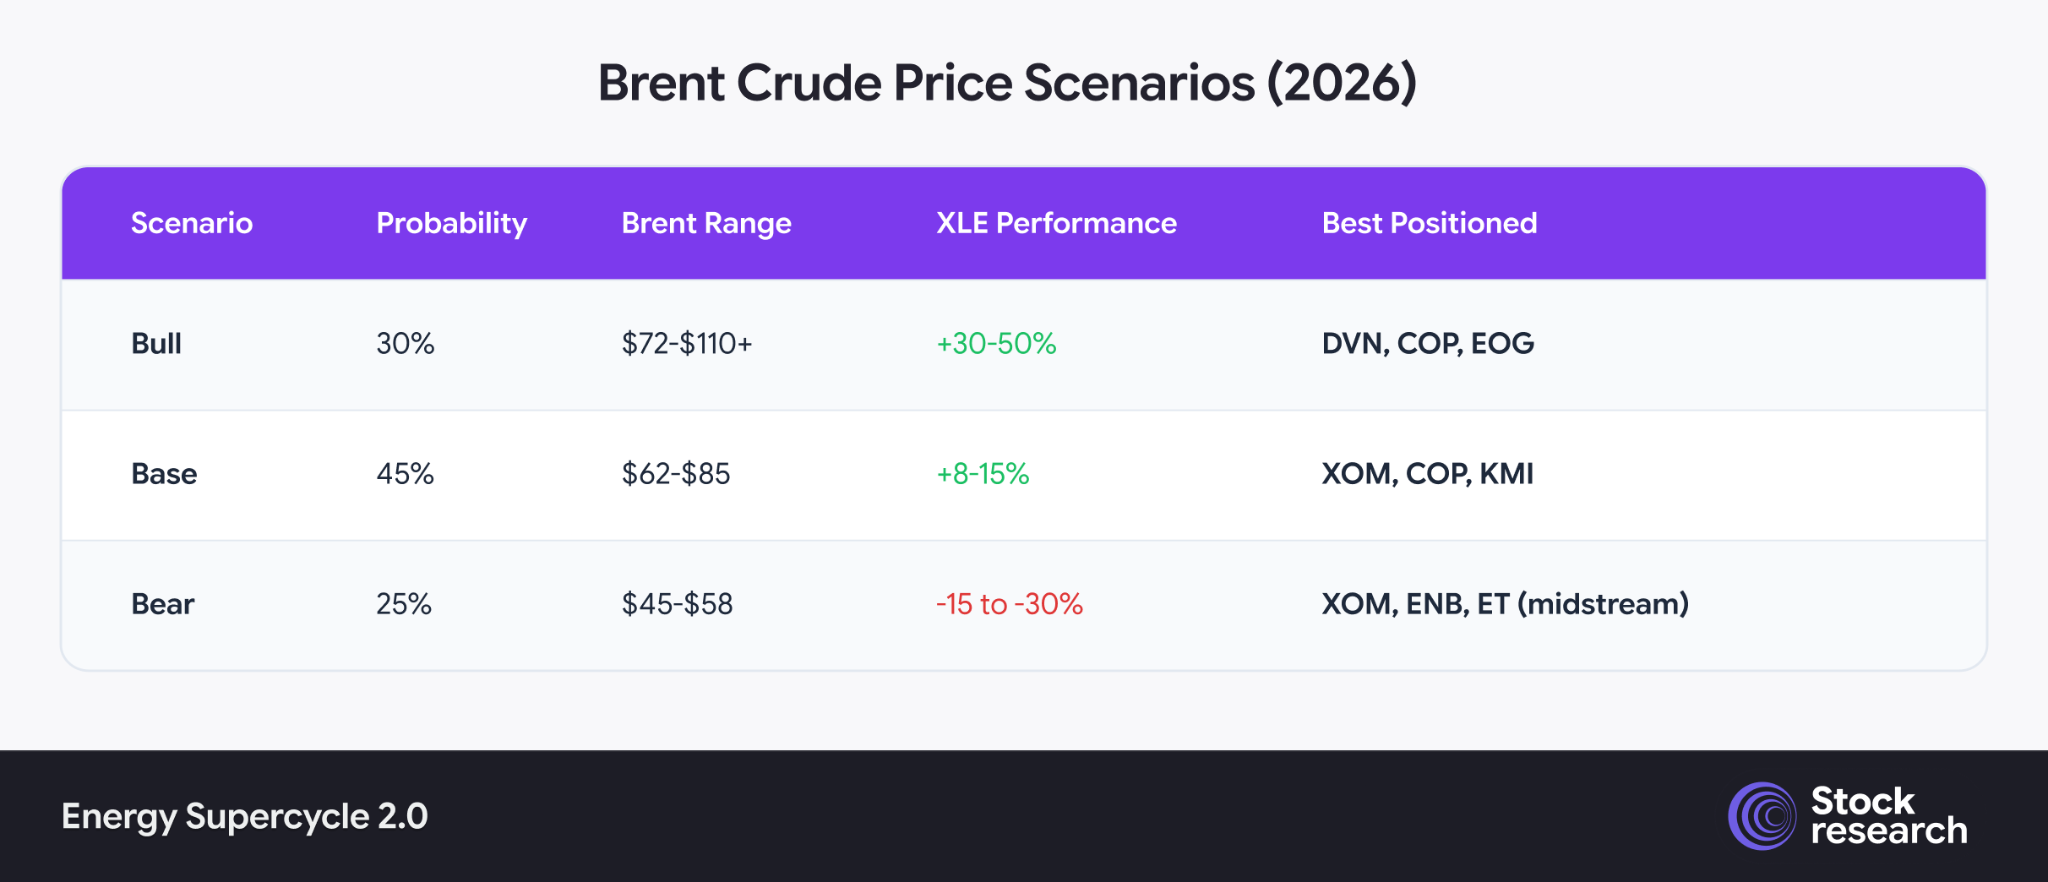
Three-scenario outlook for 2026: Bull (30%, Brent $72–$110+, XLE +30–50%), Base (45%, $62–$85, +8–15%), Bear (25%, $45–$58, -15 to -30%). High-beta E&Ps lead in the bull case; defensives (XOM, ENB, ET) outperform in the bear. Source: EIA, Goldman Sachs, J.P. Morgan.*
Here’s what’s striking about the scenario table: even the bear case doesn’t break the underlying thesis. In a recession scenario with oil at $45–$58, integrated majors like ExxonMobil (breakeven ~$30/bbl) and midstream companies with 70–90% hedged cash flows remain profitable and dividend-paying. The structural free cash flow story doesn’t die, it just pauses.
The base case (45% probability) delivers 8–15% XLE total returns before dividends. The bull case (30%) makes energy the top-performing sector two years running.
Probability-weighted, this remains one of the most asymmetric setups in public markets right now.
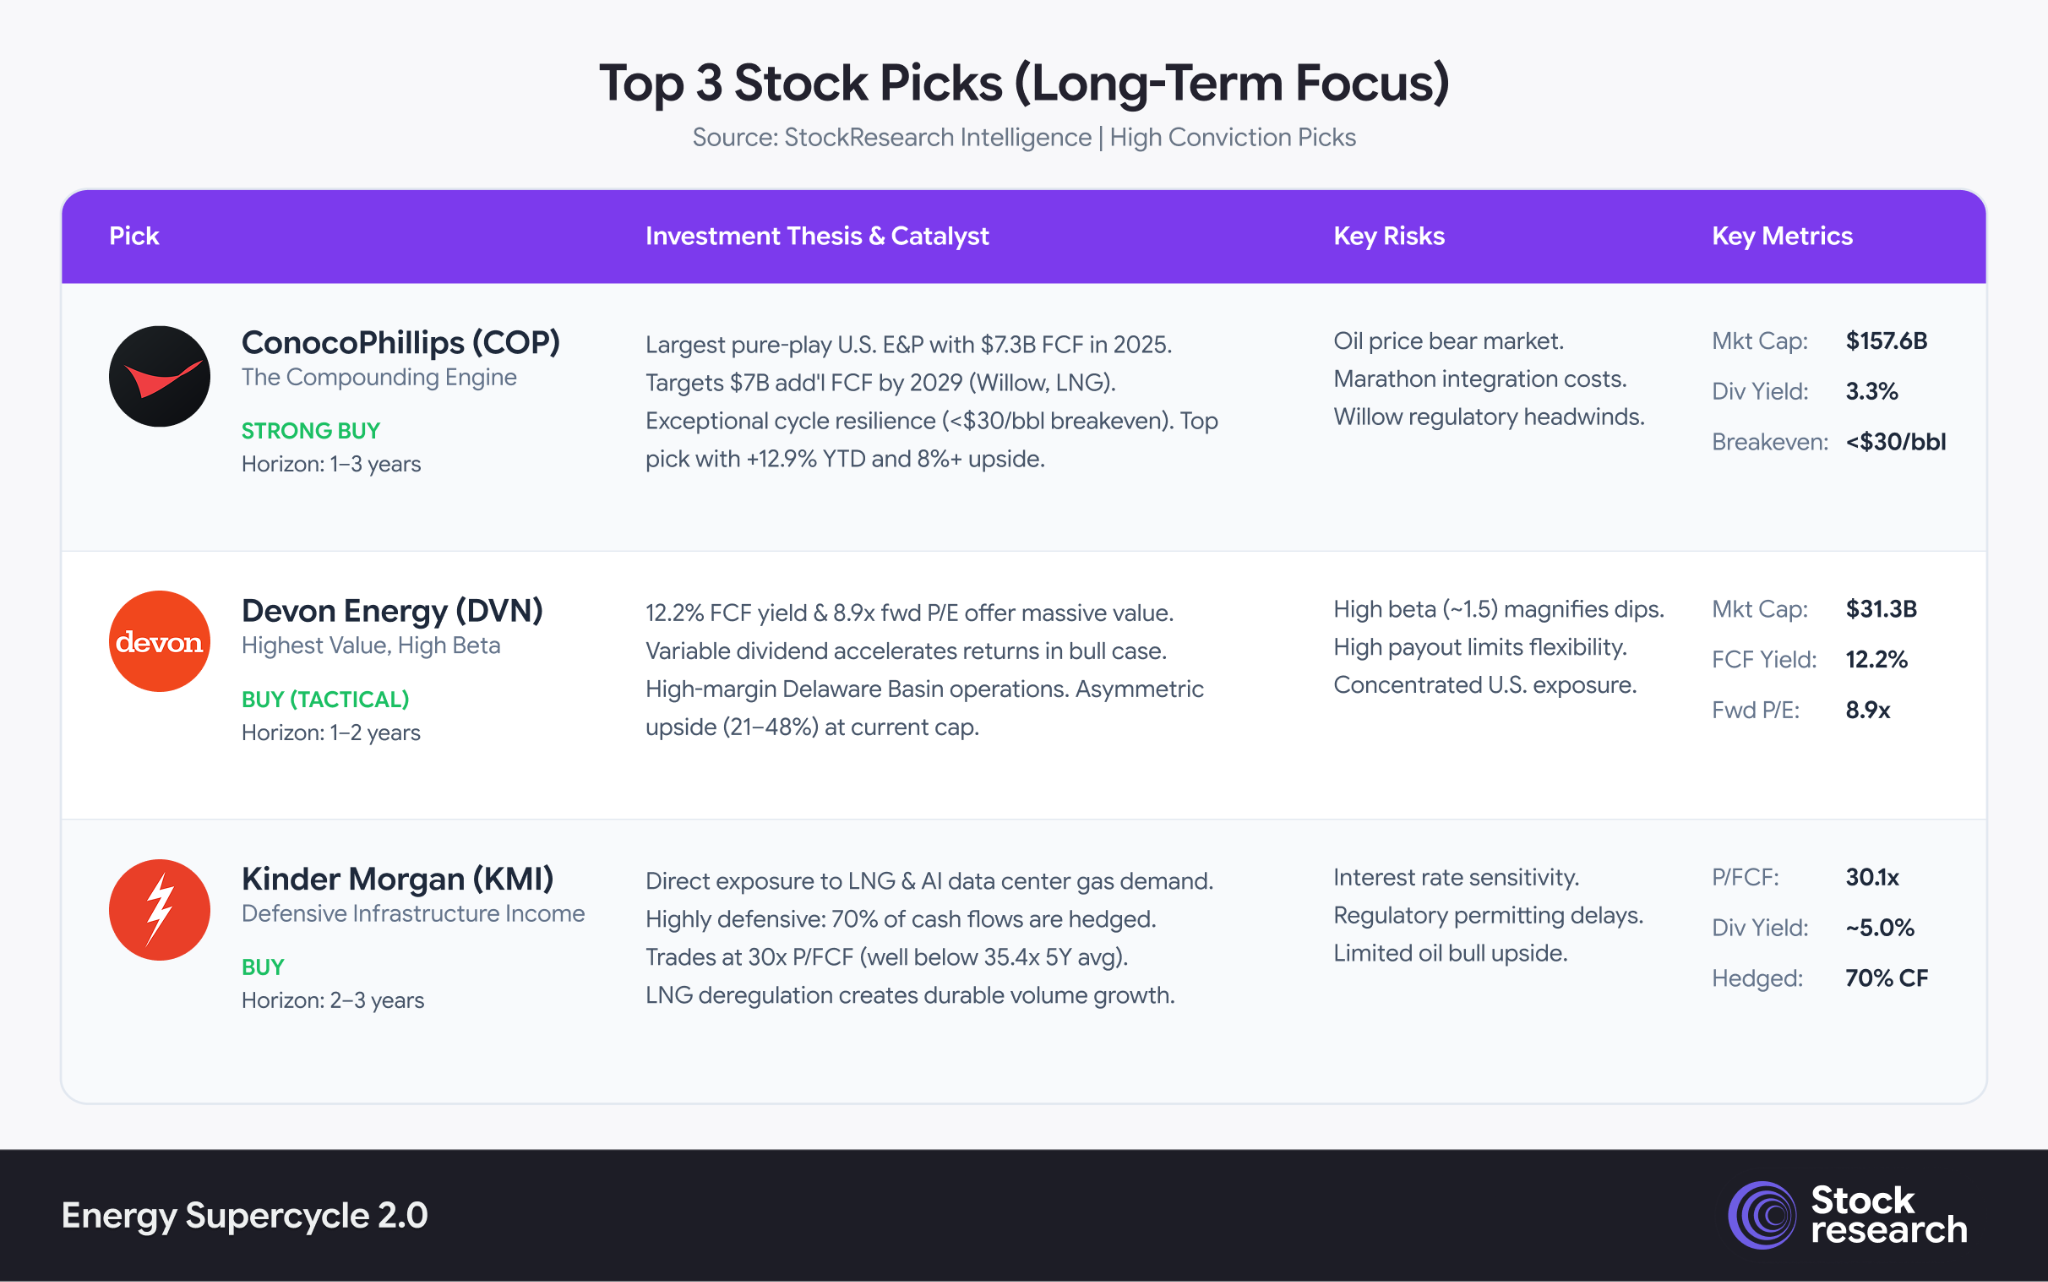
Three Names Worth Your Attention
The Honest Risk Section
No bull case is complete without the bear case. Here’s what could break this thesis:
Global recession is the biggest risk. Goldman puts 12-month U.S. recession probability at 25%. Oxford Economics estimates $140/bbl sustained for two months tips the world into contraction. If that happens, oil goes to the $40s, and E&P equities follow. Midstream and majors are far more resilient here.
Russia sanctions easing is the wildcard. A Ukraine peace deal, which the Trump administration is actively pursuing, could return 2–3 mb/d of Russian crude to available supply. Already partially priced into bearish models, but the timing is unpredictable.
OPEC+ discipline breakdown remains low probability but high impact. If Saudi Arabia decides to grab market share, they can flood supply within months. History says they won’t, but history has been wrong before.
The full report contains a complete risk matrix with probability assessments and stock-specific hedging suggestions for each scenario.
How to Think About Positioning
This isn’t a call to go all-in on oil stocks. It’s a call to stop being underweight a sector that is generating record free cash flow, trading at historic discounts, and operating in a structurally supply-constrained world.
A simple framework:
-
Conservative (5–10% energy allocation): XOM, ENB, KMI, income, resilience, low volatility
-
Moderate (10–20%): COP, XOM, KMI, balanced FCF growth + income
-
Aggressive (20–35%): DVN, COP, EOG, maximum FCF yield and sector leverage
Entry strategy: accumulate in tranches. Use WTI dips below $70 as E&P accumulation signals. Midstream can be bought anytime for income.
Exit signal: only reduce if all three conditions flip simultaneously, Hormuz resolution, full OPEC+ unwind, and global demand growth falling below 500k b/d. Until then, the structural thesis remains intact.
What to Watch in the Coming Weeks
The next 2–4 weeks will determine which scenario plays out. Monitor these indicators in order of importance:
1. Strait of Hormuz tanker traffic.
Real-time AIS (Automatic Identification System) shipping data will show whether commercial vessels are resuming transit. Track platforms like MarineTraffic or Bloomberg’s tanker flow data. This is the single most important variable for near-term oil prices — a resumption of normal traffic collapses the risk premium within days.
2. OPEC+ emergency meeting signals.
Watch for any unscheduled ministerial calls or Saudi Aramco production guidance revisions. If Riyadh signals willingness to accelerate the phaseout of cuts to offset Hormuz supply loss, that’s a bearish override of the bull case. Conversely, silence from OPEC+ is bullish — it means they’re letting the disruption tighten the market.
3. Iran’s escalation calculus.
Iran faces a strategic paradox — closing Hormuz hurts China (its primary customer) as much as the West. Watch for back-channel diplomatic signals from Beijing. A Chinese-brokered ceasefire would be the fastest path to Hormuz normalization and the single biggest downside risk to the oil bull case.
4. U.S. strategic petroleum reserve (SPR) releases.
The Trump administration has historically been willing to tap the SPR to dampen gasoline prices ahead of political pressure points. Any announcement of coordinated IEA/SPR releases would provide short-term price relief and signal that governments are acting to cap the upside.
5. 5-year breakeven inflation rate.
Currently elevated above 2.5%. A move above 2.6–2.7% signals bond markets are pricing in a structural inflation regime shift driven by energy — which would force the Fed to hold rates higher for longer and amplify energy’s role as an inflation hedge in portfolios. Watch the TIPS spread daily.
6. U.S. shale producer guidance revisions.
Earnings season is approaching. If Devon, EOG, or ConocoPhillips revise capex guidance downward citing “capital discipline,” that’s a supply-side confirmation of the structural thesis. If they surprise with production increases, it partially offsets the OPEC+ supply tightness narrative.
7. VIX term structure.
If the VIX futures curve shifts from contango (normal) into backwardation (crisis pricing), institutional investors are signaling they expect volatility to persist — not fade. That environment historically benefits hard assets and energy equities relative to growth and tech.
The bottom line on monitoring: Hormuz traffic data is your north star. Everything else is context. If ships start moving again, reduce tactical exposure. If the strait stays disrupted beyond 4–6 weeks, the bull case accelerates materially — and the full structural thesis behind this report becomes the consensus view, not the contrarian one.
This report is for informational purposes only and does not constitute investment advice. All investments carry risk, including the potential loss of principal. Past performance of any asset class, sector, or security does not guarantee future results. The scenarios, projections, and price targets discussed are based on publicly available data and analyst estimates as of March 27, 2026, and are subject to change. Readers should conduct their own due diligence and consult a qualified financial advisor before making investment decisions.