
StockResearch Intelligence Weekly #13

1. One Ceasefire Rally. No Peace Yet
The S&P 500 posted its best week in four months, climbing +3.7% to 6,817 as markets staged an aggressive relief rally on the back of a fragile US-Iran ceasefire. The Nasdaq surged +4.2%, the Russell 2000 gained +4.1%, and the Dow ripped 1,325 points higher on Wednesday alone, its best single session since April 2025. The VIX collapsed from 25 to 19.23 by Friday’s close, dropping below 20 for the first time since before the February 28 strikes.
The catalyst was straightforward: a two-week ceasefire contingent on Iran reopening the Strait of Hormuz sent oil tumbling 16% in a single session, the largest crude decline since April 2020, with WTI falling from $112 to roughly $94. Markets immediately repriced the energy shock premium that had defined the prior six weeks of trading.
But the inflation picture complicates the narrative. The March CPI print, released Thursday, showed headline inflation surging to 3.3% year-over-year, driven by a 10.9% monthly spike in energy costs and a 21.2% gasoline increase, the largest monthly jump since 1967. Core CPI, however, came in below expectations at 2.6%, suggesting the inflation impulse remains concentrated in energy rather than broad-based. If the ceasefire holds and Hormuz traffic normalizes, March may prove to be the peak print. If it collapses, markets have barely begun pricing the inflationary tail risk.
JPMorgan crushed Q1 expectations with $12.6 billion in profit, validating that bank trading desks can monetize wartime volatility without incurring credit losses. Q1 earnings season is now underway, and the question is whether the rest of corporate America navigated the quarter as well as Jamie Dimon’s team did.

2. Strengths: Where The Rally Looks Real
-
Ceasefire Unlocks the Broadest Rally Since November. Every major index posted gains above 3%, with the equal-weight S&P 500 outperforming the cap-weighted version, a sign that participation extended well beyond mega-cap tech. Industrials (+5.3%), materials, and consumer discretionary all led, suggesting genuine risk appetite rather than defensive rotation. The VanEck Semiconductor ETF (SMH) jumped over 5%, with Micron gaining 7%.
-
Oil Decline Alleviates the Single Biggest Macro Headwind. The 16% single-day crude decline represents the market’s most positive supply shock of 2026. If Hormuz traffic resumes at pre-war levels, energy CPI could reverse sharply in April, potentially pulling headline inflation back toward the Fed’s comfort zone. Gasoline futures fell in sympathy, offering direct consumer relief ahead of summer driving season. Diesel at $5.38/gallon and air freight rates up 70% during March may begin to normalize.
-
Core Inflation Remains Contained, Fed Has Cover to Hold. While headlines focused on the 3.3% CPI print, the core reading of 2.6% was actually below consensus expectations. Shelter inflation continued its slow decline. Services ex-energy showed modest deceleration. The Fed has explicitly stated it will look through energy-driven volatility, core CPI gives them the cover to hold rates steady rather than hike, preserving the possibility of cuts later in 2026 if the ceasefire holds.
-
JPMorgan’s Q1 Blowout Sets a Bullish Earnings Template. JPM reported $12.6 billion in Q1 profit, with NII jumping 10.1% year-over-year to $25.6 billion and trading revenue surging on wartime volatility. The bank announced a $2 billion renewable energy investment commitment. If other financials follow this template, chaos as a revenue generator rather than a credit destroyer, earnings season could provide the fundamental floor this rally needs. Goldman Sachs, BofA, and Citigroup report next week.
3. Weaknesses: Where The Story Still Breaks
-
Ceasefire Is Fragile and Conditional, History Suggests Low Holding Probability. The two-week window is contingent on Iran reopening Hormuz and both sides maintaining restraint. Previous de-escalation attempts have collapsed within days. Markets are pricing a best-case scenario that historically has a low base rate of holding. Any resumption of hostilities would reverse the oil and equity moves violently, the Dow’s 1,325-point rally could unwind in a single session.
-
Headline Inflation Is Still Accelerating Despite Core Softness. The 3.3% annual CPI rate is the highest since early 2024. While core is contained, the political and consumer perception of inflation is dominated by gas prices and grocery bills, diesel at $5.38/gallon, war-risk insurance premiums surging 1,000%+, and air freight rates up 70%. This limits the Fed’s ability to cut rates even if they want to, and more critically, it constrains consumer spending power heading into Q2. Retail sales data next week will reveal the damage.
-
Semiconductor Export Restrictions Remain Unresolved. Despite the rally in chip stocks, the administration’s proposed tightening of AI chip export controls to the Middle East and Southeast Asia remains on the regulatory calendar. NVIDIA and AMD both face potential revenue headwinds if the rules finalize as drafted. The ceasefire rally may have temporarily obscured a structural policy risk for the sector’s highest-growth segment.
-
Valuation Compression Risk Intensifying in AI Names. Palantir fell 13.7% for the week after Michael Burry flagged valuation concerns at 202x earnings. The broader AI trade has pushed several names to valuations that require perfect execution for multiple quarters. Any earnings miss in the upcoming cycle could trigger rapid de-rating across the AI complex, and the export restriction overhang makes perfect execution harder to guarantee.
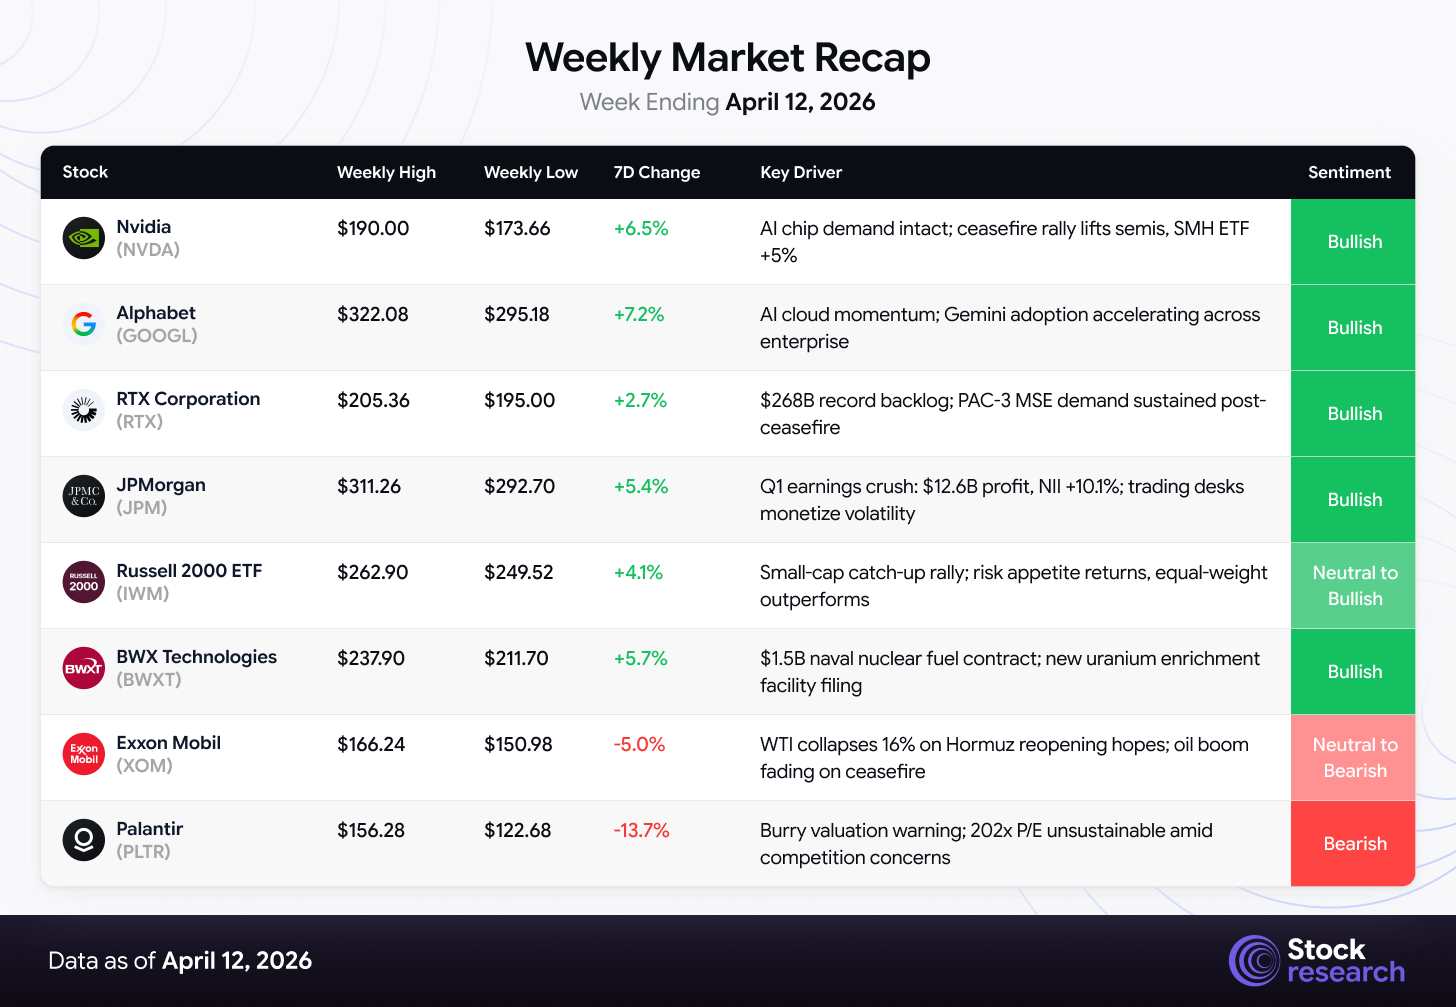
4. Weekly Market Recap – Week Ending April 12, 2026
5. Top 3 Stock Picks for Long-Term Investment
AI Price Forecast Dashboard
Powered by StockResearch AI — Updated Week Ending April 5, 2026
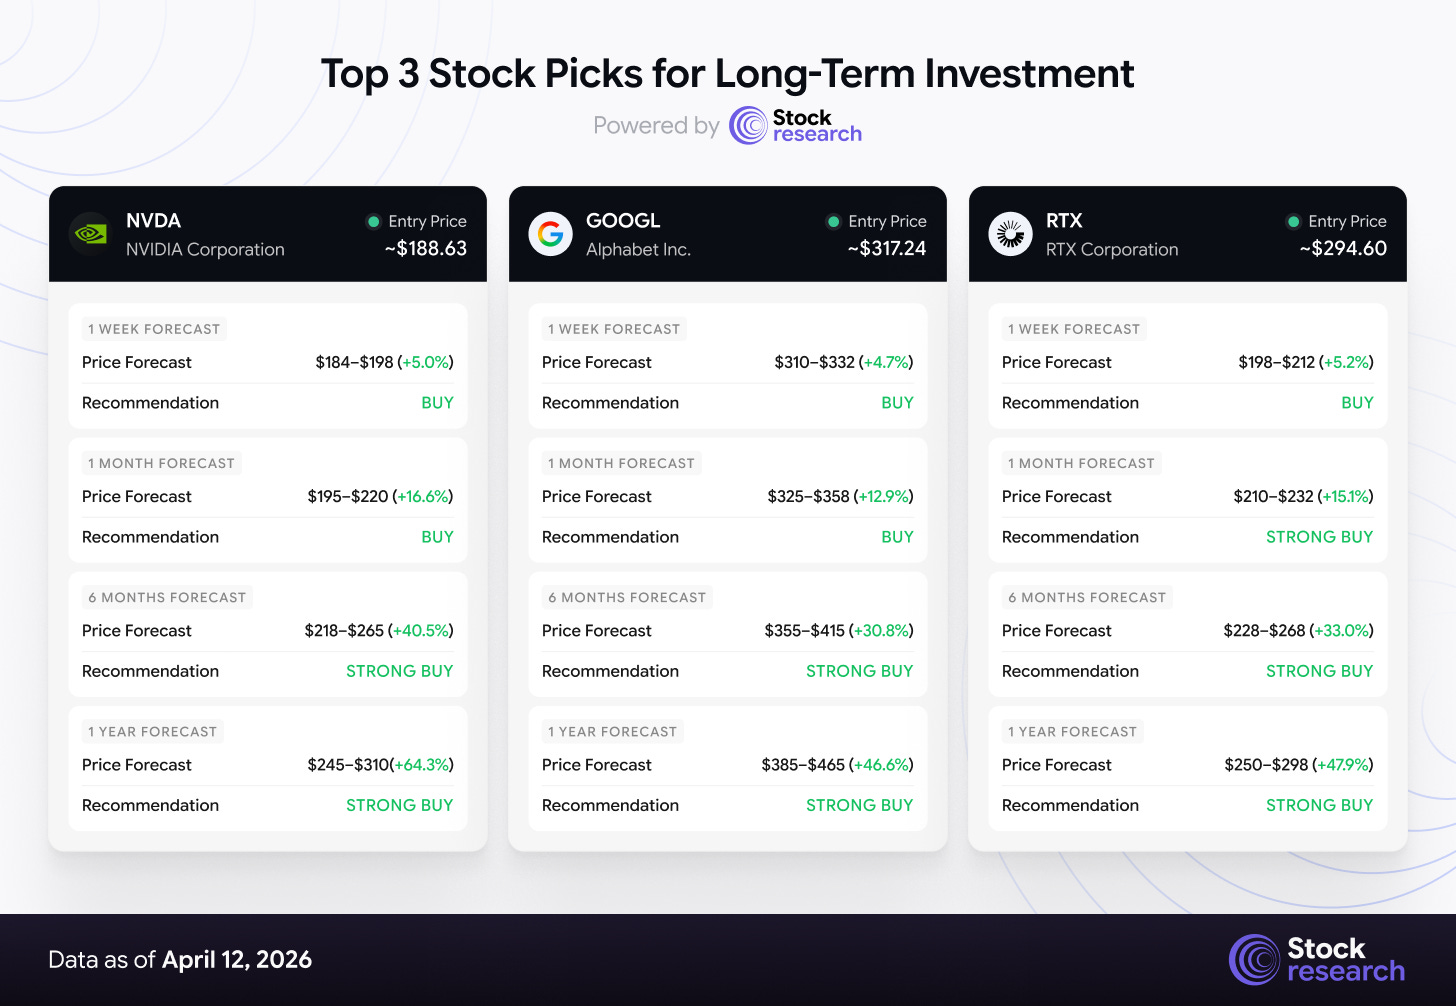
#1: NVIDIA Corporation (NVDA)
Price: $188.63 | Market Cap: $4.64T | P/E (Forward): 38.5x | 52W Range: $95.04–$212.19
Thesis: NVIDIA remains the undisputed king of the AI compute stack. While competitors gain share at the margins, NVIDIA’s CUDA ecosystem moat, Blackwell architecture ramp, and data center revenue dominance ($130B+ annualized run rate) make it the single most important company in the AI infrastructure buildout. The stock is trading 9% below its all-time high of $207, creating a rare opportunity to own the market leader at a discount to its October 2025 peak.
Why now: The ceasefire rally lifted semiconductors broadly, with SMH gaining over 5% for the week. But NVIDIA’s move to $188.63 (+6.5%) still leaves it well below its highs. The company’s upcoming earnings will be the next major catalyst, and consensus expects another blowout quarter driven by Blackwell shipments and data center demand that shows no signs of saturation. Hyperscaler capex commitments, Meta’s $21B CoreWeave deal, Microsoft’s continued Azure expansion, Google’s Gemini infrastructure buildout, all flow directly through NVIDIA’s supply chain.
Key Levels: Support at $173.66 (this week’s low). Resistance at $207 (ATH close). A break above $207 on volume would signal the AI trade has resumed its 2025 trajectory.
Risk Factors: Export restriction tightening to Middle East and Southeast Asia could cap growth. China revenue has already been curtailed. Valuation at 38.5x forward is not cheap, any demand deceleration would compress the multiple quickly
#2: Alphabet Inc. (GOOGL)
Price: $317.24 | Market Cap: $1.95T | P/E (Forward): 19x | 52W Range: $152.26–$338.25
Thesis: Alphabet is the most undervalued mega-cap in the AI race. At 19x forward earnings, it trades at a meaningful discount to peers despite owning the most comprehensive AI stack in the industry: Gemini models, Google Cloud (growing 30%+ YoY), YouTube’s AI-driven ad optimization, Waymo’s autonomous vehicle leadership, and DeepMind’s research pipeline. The market is pricing Alphabet as a legacy search company when it’s actually an AI conglomerate trading at a value multiple.
Why now: GOOGL surged +7.2% this week to $317.24, its best weekly performance of 2026. Google Cloud is winning enterprise AI workloads as companies diversify beyond AWS. Gemini 2.5 adoption is accelerating, and YouTube’s AI-generated ad creative tools are driving mid-market advertiser spend. The stock remains 6% below its 52-week high of $338.25, creating an attractive entry before Q1 earnings (likely late April). The antitrust overhang is real but largely priced, even a worst-case remedy would take years to implement.
Key Levels: Support at $295.18 (this week’s low). Resistance at $338.25 (52-week high). A decisive move above $320 would confirm the breakout.
Risk Factors: Antitrust ruling remedies remain the primary overhang. European Digital Markets Act compliance is a margin headwind. Any deceleration in cloud growth would challenge the re-rating narrative.
#3: RTX Corporation (RTX)
Price: $201.56 | Market Cap: $146B | P/E (Forward): 24x | 52W Range: $112.63–$214.50
Thesis: RTX is the most diversified play on the defense spending supercycle. With a record $268 billion backlog (up 23% YoY), the largest in the aerospace and defense industry, and a 20% increase in munitions output through 2025, RTX is positioned to benefit regardless of whether the ceasefire holds or collapses. The Patriot/NASAMS missile systems are seeing unprecedented demand tied to Iran conflict consumption, while the commercial aerospace recovery provides a parallel revenue stream. Q1 2026 earnings on April 21 are the next catalyst.
Why now: RTX gained a modest +2.7% for the week to $201.56, underperforming the broader market as ceasefire hopes capped defense sentiment. But this is precisely the entry logic: defense stocks dip on peace headlines, yet the actual procurement cycle is multi-year. RTX has beaten consensus EPS in each of the last four quarters. The company guided 2026 adjusted sales of $92–93B with 5–6% organic growth, adjusted EPS of $6.60–$6.80, and free cash flow of $8.25–$8.75B. The stock trades 6% below its March all-time high of $214.50.
Key Levels: Support at $195.00 (this week’s low). Resistance at $214.50 (ATH). A hold above $200 into earnings would be constructive.
Risk Factors: Sustained peace that materially reduces defense appropriations would challenge the backlog conversion. The P/E has expanded from 15x to 24x in twelve months, if growth disappoints, the valuation compresses. Execution risk on the Pratt & Whitney GTF engine recall remediation.
6. Low-Cap Opportunities: Undiscovered Value
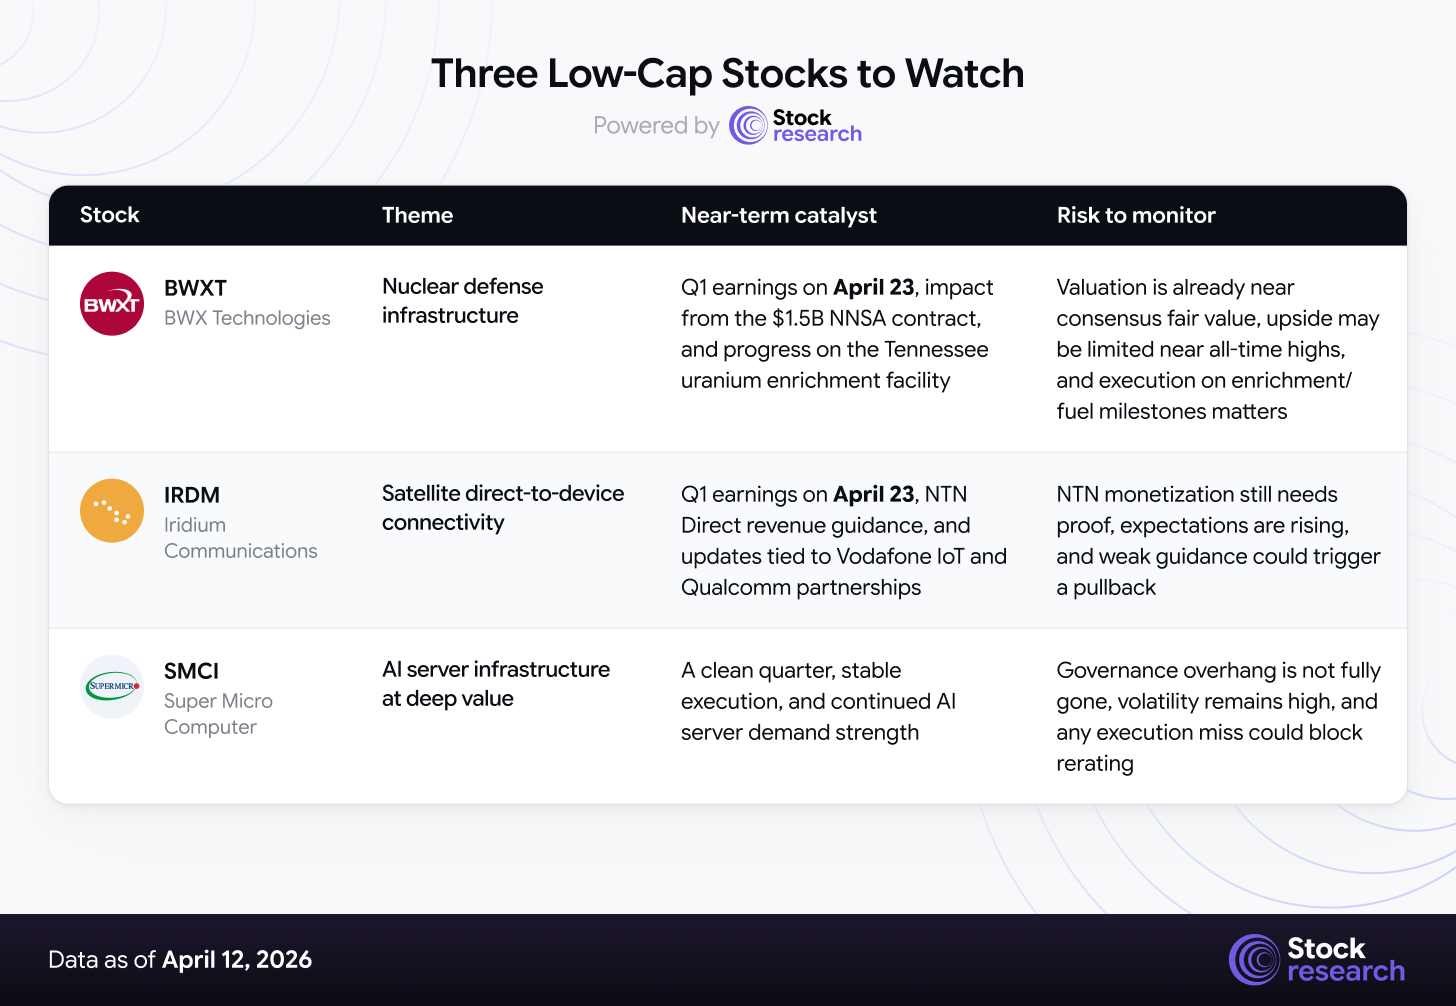
BWX Technologies (BWXT), Nuclear Defense Infrastructure
Price: $229.57 | Market Cap: $7.0B | Weekly Change: +5.7% | 52W Range: $99.41–$237.90
BWX Technologies manufactures naval nuclear reactors and fuel for the US submarine and aircraft carrier fleet, a sole-source capability with decade-long contract horizons. The company recently secured a $1.5 billion contract with the National Nuclear Security Administration for naval and defense fuel supply and has begun the regulatory process for a new uranium enrichment facility in Erwin, Tennessee, using advanced centrifuge technology developed with the Department of Energy.
Why watch it: Nuclear propulsion is the one defense category that is genuinely non-discretionary. Regardless of ceasefire status, the Navy’s Columbia-class and Virginia-class submarine programs require BWXT’s fuel. The stock gained +5.7% this week to $229.57, sitting just 3.5% below its all-time high of $237.90. Analyst consensus target stands at $231, implying the stock is approaching fair value, but upward revisions are likely as the enrichment facility comes online. Q1 earnings on April 23 are the next catalyst.
Iridium Communications (IRDM), Satellite Direct-to-Device
Price: $34.20 | Market Cap: $4.4B | Weekly Change: +4.8% | 52W Range: $22.24–$42.24
Iridium operates the only fully global satellite communications network and is making a strategic push into the direct-to-device market through its NTN Direct service. Successful on-air two-way messaging tests in January 2026, combined with partnerships with Vodafone IoT for NTN NB-IoT connectivity and Qualcomm for tactical radio integration, position the company at the forefront of the satellite connectivity buildout that analysts project will exceed $25 billion by 2030.
Why watch it: Iridium’s LEO constellation advantage, already operational, unlike competitors still in launch phase, provides a first-mover moat in satellite direct-to-device. The stock surged nearly 14% earlier in the month on the Q1 earnings call announcement alone, signaling that the market is beginning to price in the NTN revenue opportunity. Q1 earnings on April 23 will be the first opportunity to see NTN-related revenue guidance. At $34.20 and 12x forward EBITDA, the stock trades at a discount to satellite peers despite stronger positioning.
Super Micro Computer (SMCI), AI Server Infrastructure at Deep Value
Price: $25.26 | Market Cap: $14.8B | Weekly Change: +9.5% | 52W Range: $18.01–$66.00
Super Micro has been one of the most volatile names in the AI trade, the stock collapsed over 60% from its highs amid accounting concerns and a delayed 10-K filing. But the company has since resolved its audit issues, restated financials, and maintained its NASDAQ listing. The underlying business remains strong: SMCI is a primary server assembler for NVIDIA’s GPU platforms, and AI data center buildout demand is accelerating. The +9.5% weekly gain suggests the market is beginning to separate the operational story from the governance overhang.
Why watch it: At $25.26, SMCI trades at roughly 0.5x forward revenue, a fraction of its AI infrastructure peers. If the company can demonstrate clean quarters and consistent execution, re-rating potential is significant. The risk/reward is asymmetric: downside is largely bounded by tangible book value, while upside scenarios price in a return to normalized AI server demand multiples. Not for the faint-hearted, but the setup rewards patience.
7. Strategic Recap & Forward Outlook
Week in Review
The S&P 500 gained 3.7% for its second consecutive winning week, with the Nasdaq outperforming at +4.2% as semiconductors and AI names led the charge. The Dow’s 1,325-point Wednesday session was the headline move, driven by ceasefire-induced oil repricing. JPMorgan’s blowout Q1 earnings ($12.6 billion profit) validated the thesis that bank trading desks can monetize volatility without incurring credit losses. WTI crude’s 16% collapse was the largest single-day decline in six years. Breadth was strong, with the Russell 2000 ETF (IWM) gaining 4.1% and industrials leading all sectors at +5.3%.
Forward Outlook, Week of April 13–19, 2026
-
Macro Watch: The week pivots on two variables: (1) whether the Iran ceasefire survives weekend talks, and (2) how markets digest the remaining bank earnings cycle. Goldman Sachs, Bank of America, and Citigroup all report this week. Retail sales data (Wednesday) will reveal whether the energy price shock has dented consumer spending. The FOMC is in blackout ahead of the May meeting, watch for any pre-blackout signals on the inflation path.
-
Earnings Calendar: GS (Monday), BAC and C (Tuesday), NFLX (Thursday). Netflix is the first mega-cap tech to report and will set the tone for the growth/valuation debate heading into NVDA and GOOGL later in the cycle.
-
S&P 500 Key Levels: Resistance at 6,900 (pre-war high) is the critical level. A decisive close above 6,900 would confirm the ceasefire rally as a structural breakout rather than a bear market bounce. Support at 6,600 (50-day moving average), failure to hold would suggest the March lows near 6,200 are back in play.
-
Positioning Framework: Cautiously overweight equities with a clear hedging plan. Lean into defense names that work in both war and peace scenarios (RTX). Maintain AI exposure through names with fundamental earnings support rather than valuation expansion alone (NVDA, GOOGL over PLTR). Keep enough cash to add aggressively if the ceasefire breaks and markets retest the March lows. The signal-to-noise ratio improves this week as bank earnings provide the first real fundamental data of the quarter.
The Bottom Line
This was a week defined by the tension between sentiment-driven optimism and unresolved structural risk. The ceasefire rally was real, broad, deep, and accompanied by genuine volume, but it was built on the assumption that a conditional two-week truce will hold and eventually lead to durable peace. The CPI print reminded us that even if hostilities end, the inflationary damage is already in the pipeline. Let the data lead.
Disclaimer
This analysis is for informational purposes only and should not be construed as investment advice. Equity markets carry substantial risk, including the potential loss of principal. Past performance does not guarantee future results. Price targets are based on analytical frameworks and current market data but involve significant uncertainty. Always conduct your own due diligence and consult a qualified financial advisor before making investment decisions.